Opti Management Portal User Guide
Welcome
Welcome to the User Guide for the Opti Management Portal. The Opti Management Portal is where you monitor and control your Opti deployments and where Account Administrators manage changes to their Opti Accounts. Access the Opti Management Portal at https://manage.onopti.com.
Getting Started
System Requirements
Access the Opti Management Portal from any modern web browser. For the best experience, we recommend using the latest version of Google Chrome, Mozilla Firefox, Microsoft Edge, or Safari. The portal should work well on both desktop and tablet devices supporting a minimum window width of 768 pixels. For optimal performance, use a desktop or laptop computer with a stable internet connection.
My User Account
You can use a single account to access all features of the Opti Platform. You may need to re-verify your identity occasionally when switching between sites to keep your session secure.
Log In to Your Account
Follow these steps to access your account:
- Go to https://manage.onopti.com.
- Sign in using your company credentials if prompted.
- If you do not have company credentials, follow the prompts on the Microsoft Live page to enter or create your username and password.
If your organization uses Single Sign-On (SSO) with Office 365 or Microsoft Entra ID (Azure Active Directory), you can also access the portal from the Microsoft My Apps page.
Getting Access to the Opti Management Portal
As part of customer onboarding, Opti invites people who are identified by email as a Company Contact in the signed Scope Of Work document to have the Administrator role in the new Account. These initial Administrators can then invite other users by email address to be additional Administrators in the Account (see Manage Account Administrators). Contact your organization's Opti Account Administrator if you believe you should have access to the Opti Management Portal and do not.
Site Navigation
The Navigation Menu
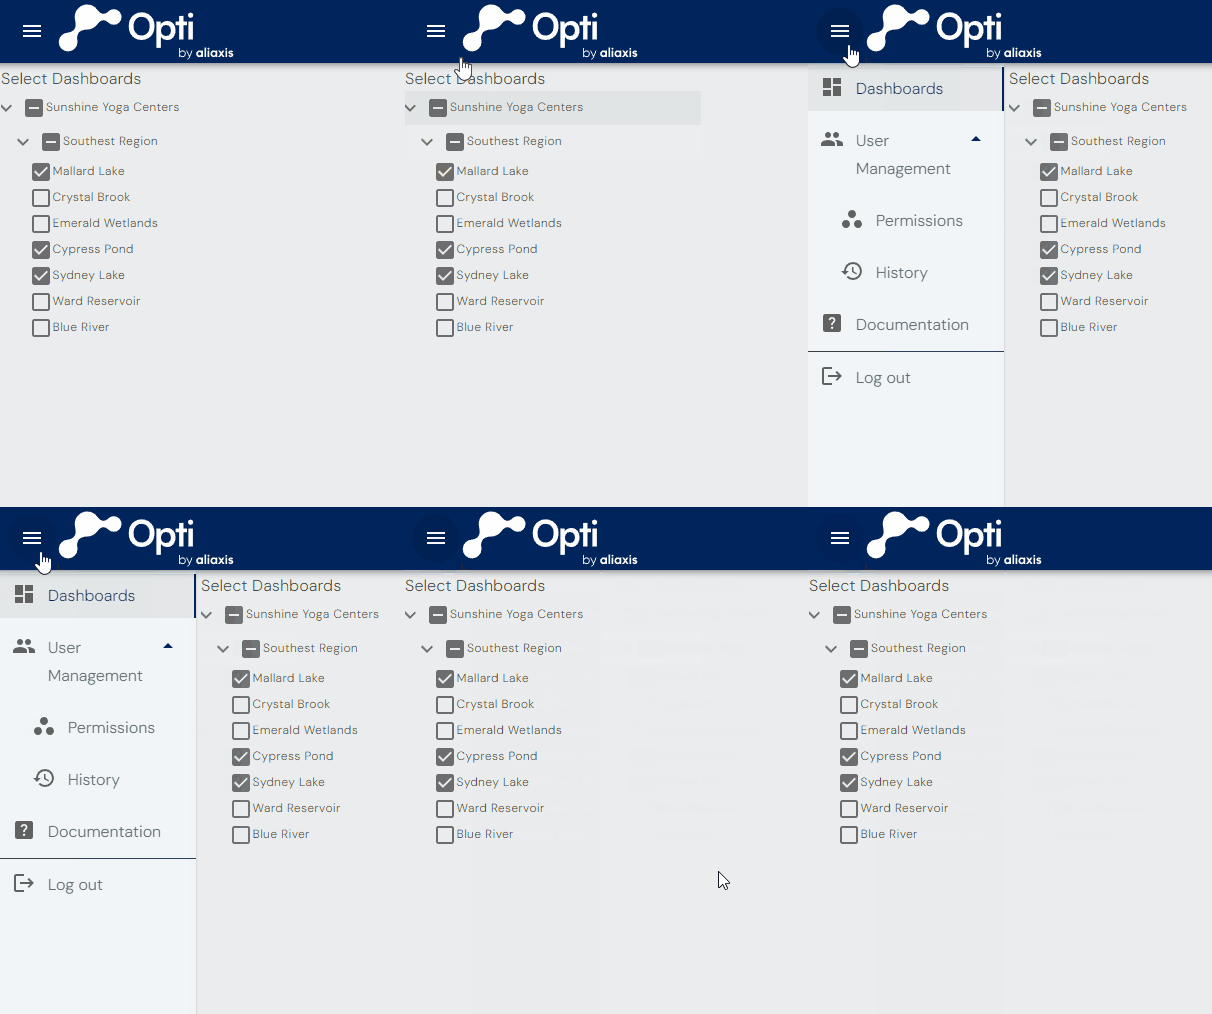
Use the Navigation Menu on the left to skip forward to specific management functions.
Getting Help
See the Support and Feedback section for assistance with the Opti Management Portal.
Logout
Click the Logout button at the bottom of the Navigation Menu to sign out. Note that users with Single Sign-On enabled may still be signed in to their identity, but their session with the Opti Management Portal will be terminated.
Dashboards
Accounts and Networks
The Opti Management Portal organizes dashboards into Networks, which group related stormwater Facilities by location, function, or jurisdiction. The Networks and dashboards you see depend on the permissions assigned to you.
- Account – Your organization in the Opti Platform.
- Network – A collection of related stormwater Facilities.
- Dashboard – A real-time view used to monitor and control the Facilities within a Network.
- Role – Determines what Networks and features a user can access.
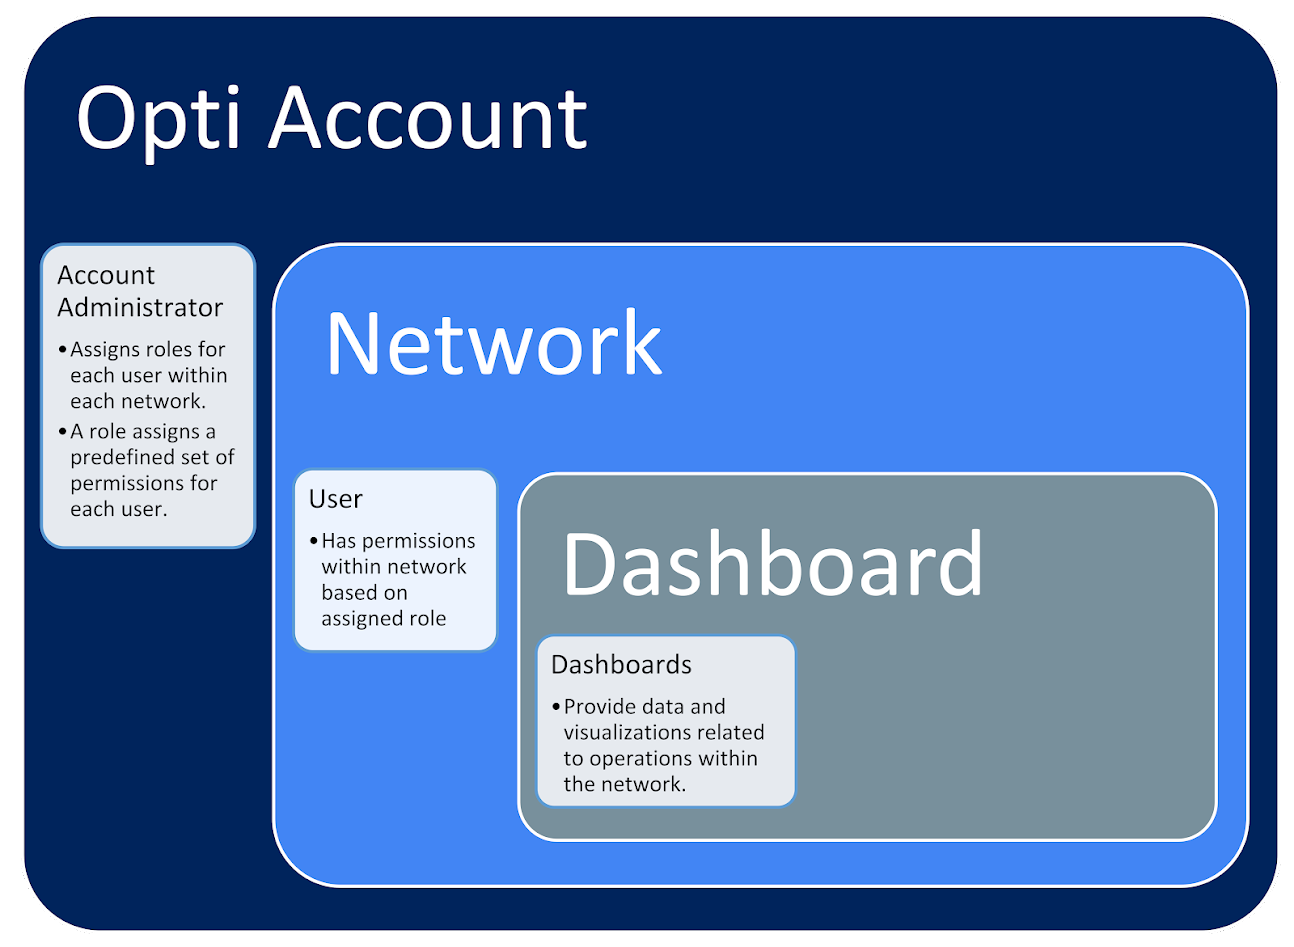
To access a dashboard, a user must be assigned a role within the Network. Account Administrators manage users, assign roles, and control access to Networks and dashboards.
Once granted access to a Network, you can navigate to its dashboards from the Dashboards page.
Navigate to Your Dashboards
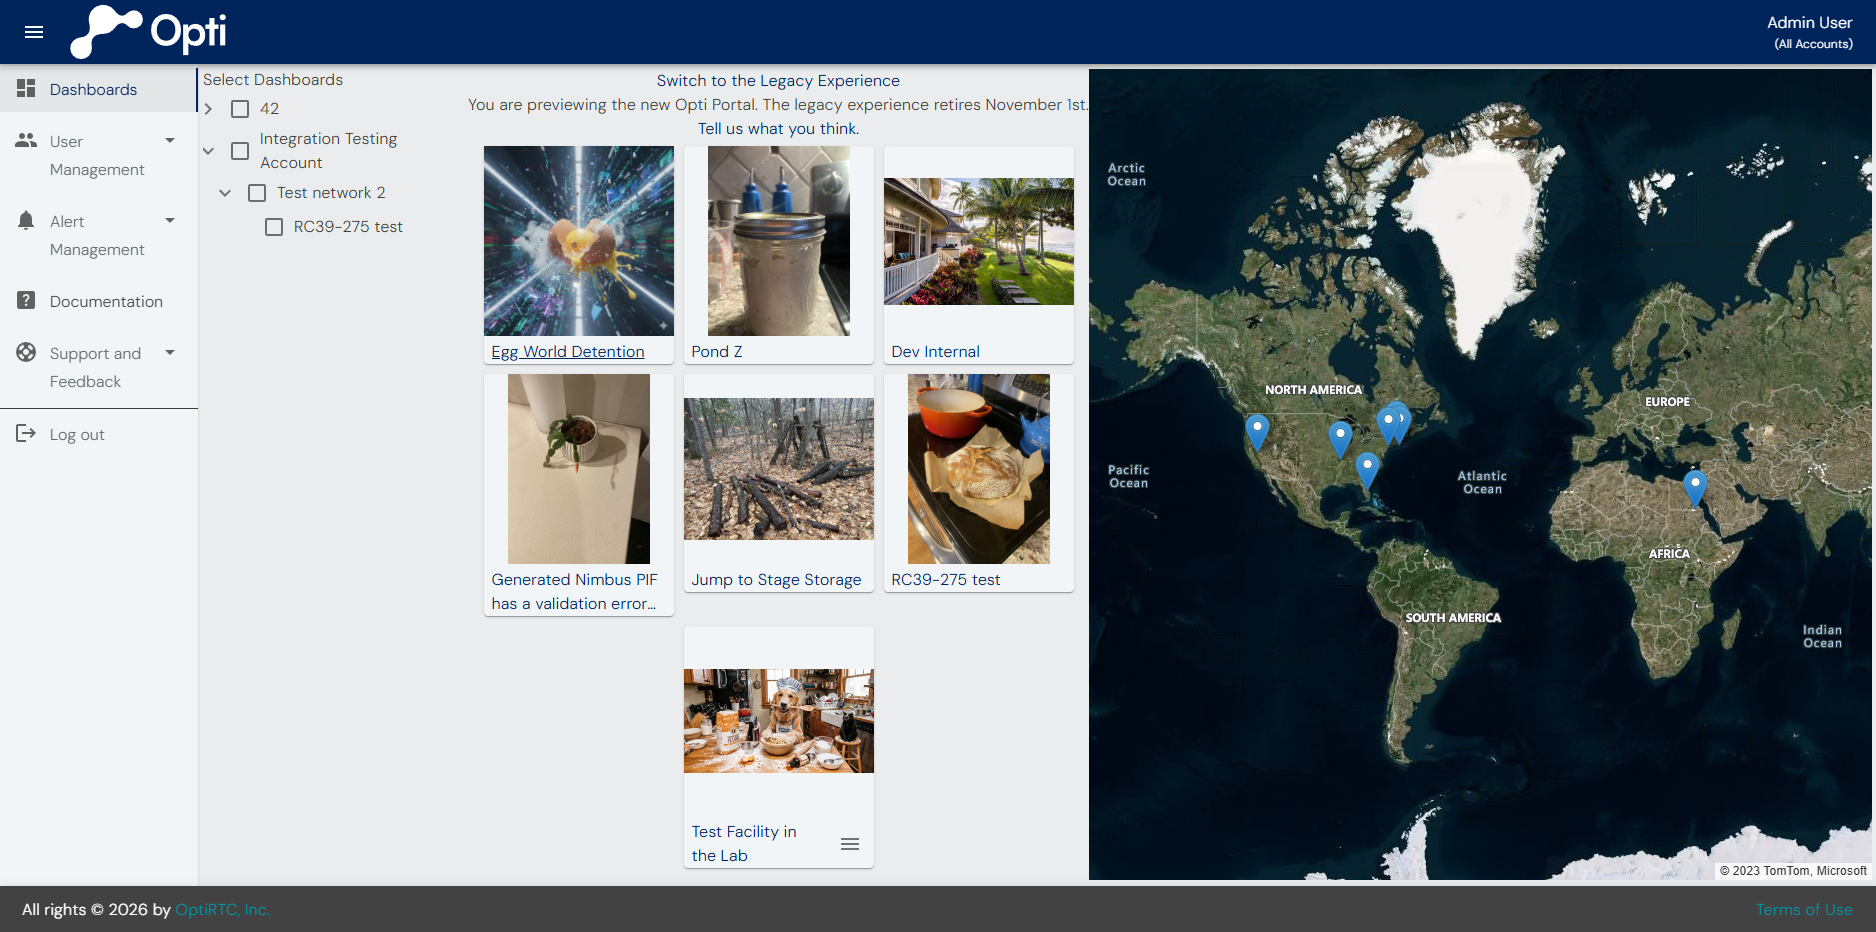
From the Navigation Menu, select Dashboards to go to the Dashboards page. If you have access to multiple facilities, signing in takes you to the Home View, where you can browse and filter your dashboards. If you only have one facility, Opti sends you directly to that dashboard after login.
Finding a Dashboard
Use the Select Dashboards panel to browse Dashboards of the facilities in the Accounts and Networks you have access to. Check the box next to an Account or Network to filter the list of facility Dashboards, or click the arrow to see a list of Networks and facility Dashboards in that Account or Network. Facility Dashboards appear as thumbnails in the center panel and as pins on the map to the right.
Click the three-line menu icon next to the Opti logo to hide the management panel and give the map and thumbnails more room.
Opening a Dashboard
From the Select Dashboards panel, click a thumbnail to open the corresponding dashboard directly.
Tip
Administrators can determine which Network(s) to invite others to by looking at which dashboards are in which Network here as well.
Using the Map
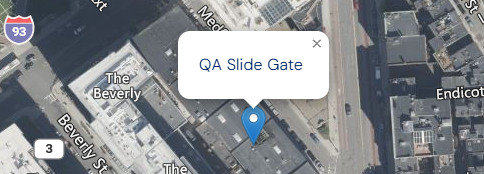
Click a pin to reveal a pop-up with the dashboard's name. Click the name to open that dashboard.
Remote Control
For all Facilities with Control deployed, Remote Control is the default Dashboard view. The Remote Control page includes a remote control pane, system status and weather info, and interactive charts showing current and recent historical conditions for Storage, System Events, Weather Forecast, and Panel Connectivity. A Camera tab provides access to cameras associated with that Facility, and a Notes tab provides operations notes in a standard place for all users of the dashboard. On the far right Explore links to Data Explorer pre-filtered to only show the metrics of this facility.
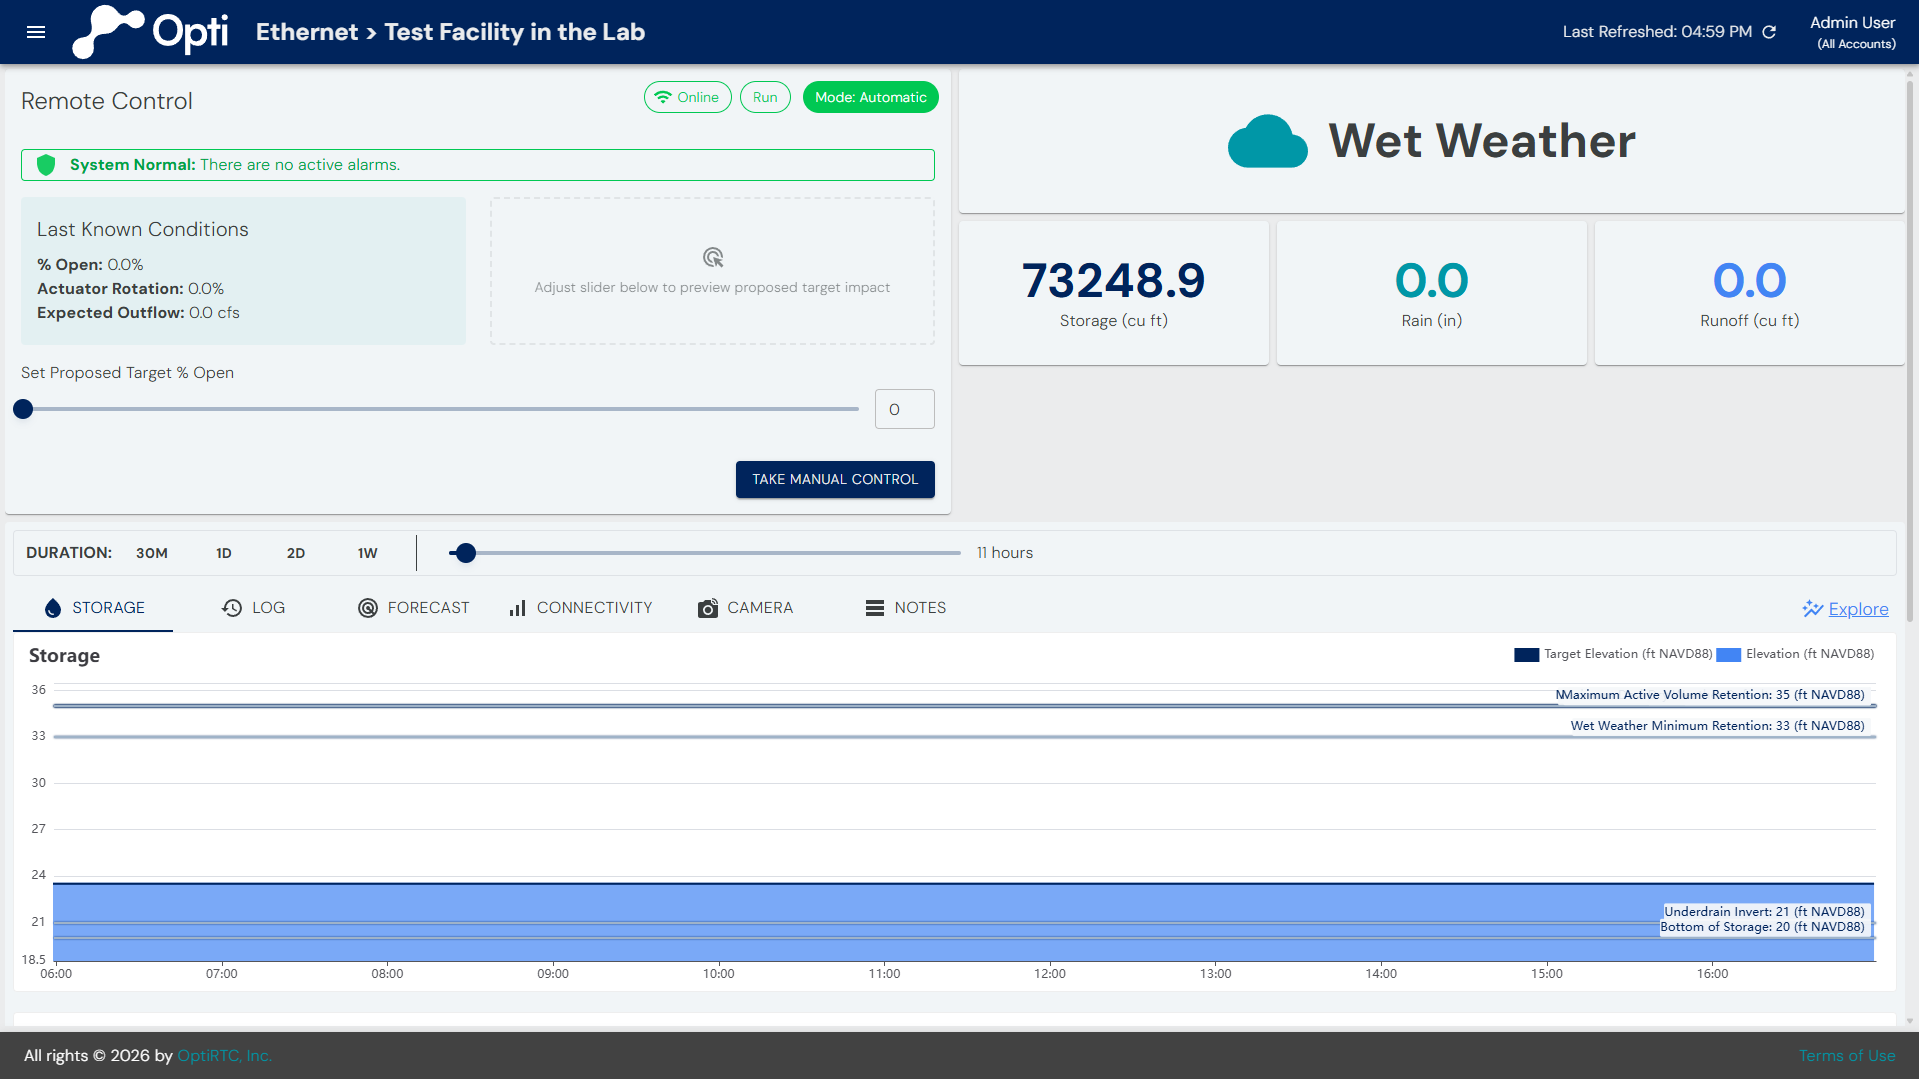
Change the Operation Mode from Automatic to Manual Control
With CMAC, Opti controls your site automatically. To override that automation for planned maintenance, winterization, or any other reason, users with the Remote Operator role can take manual control from the Remote Control pane.
Set your target with the Set Proposed Target % Open slider, or type a value into the box beside it and press Enter. Proposed Target fills in the resulting flow area, actuator rotation, and expected outflow next to your current values, and Take Manual Control becomes available. Revert clears the proposed changes.
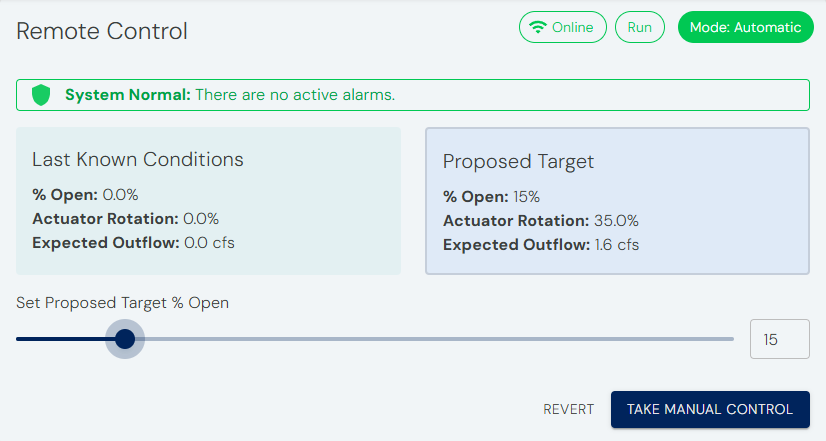
If the goal is a set release rate, drag the slider until Expected Outflow reads your target.
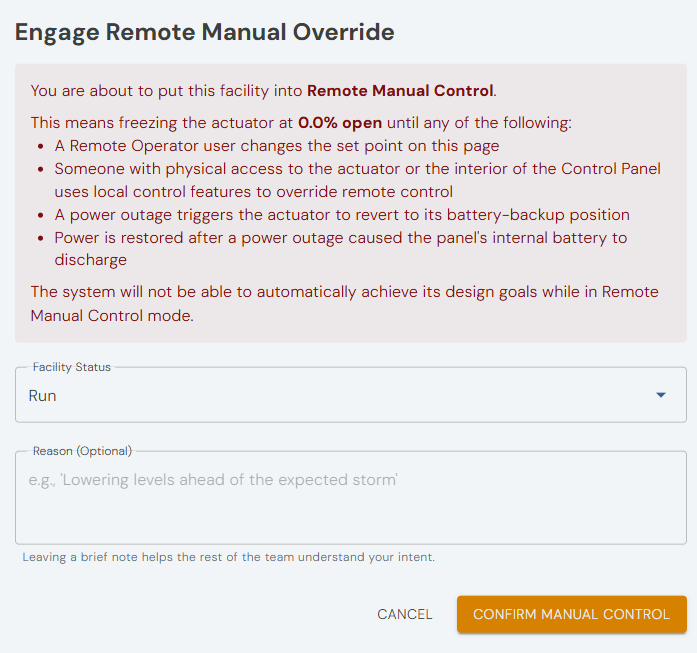
Click Take Manual Control. The confirmation dialog states the position the actuator will hold and warns that Opti cannot pursue its design goals while in manual.
Use Set Facility Status to record why: planned maintenance, winterization, or another reason. The Reason field is optional free text, and it is where you leave notes for your team.
Click Confirm Manual Control to commit, or Cancel to back out. The actuator holds that position until someone changes it or returns the site to automatic.
The Opti system then verifies the change on the panel. While a request is pending, no one can submit another remote control request, and it cannot be cancelled. If a request fails, usually due to cellular dropout, the pane returns to its previous state and you can submit again. Verification can take several minutes.
Switch from Manual Control Back to Automatic Control
If in manual control, follow the same procedure as above to return to automatic control.
Failsafe Mode
The system will automatically switch into Failsafe Mode when specified conditions are met — for example, when the Control Panel has not received a command from the Opti Cloud in too long (Data Trust Failsafe), when a backup power supply is nearly exhausted (Low Power Failsafe), or when site-specific local control rules apply (Custom Failsafe). When the panel transitions into a Failsafe Mode, it moves the actuator to a pre-configured position. To switch out of Failsafe Mode, select Manual Control from the Remote Control pane. For a detailed description of each Failsafe Mode, see the Legacy Opti Portal User Guide.
System Status
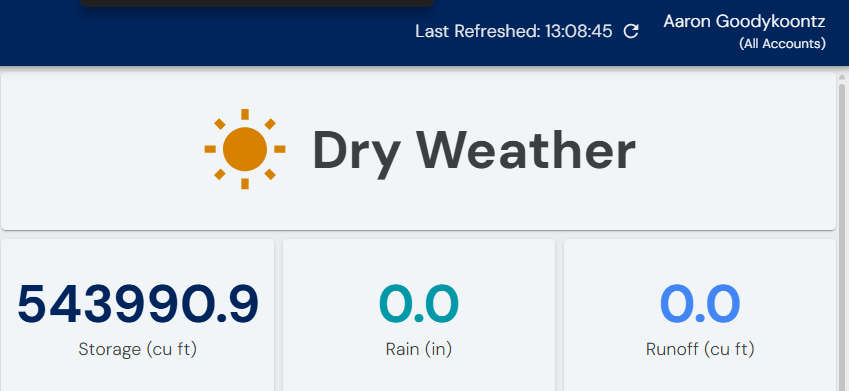
The System Status pane provides an overview of current storage capacity and forecasted storm conditions, including expected rainfall and runoff. The Opti system uses this information to inform active control.
Recent Facility History
The bottom half of the page provides interactive data visualizations of recent facility history, including storage, an event log, forecast, connectivity, and monitoring cameras. Different tabs show different types of information, and update automatically to reflect the selected time period.
Setting the Duration
Duration controls how far back from real time the Facility History charts show data.
There are two ways to set it:
- Quick buttons. Click 30M (30 minutes), 1D (1 day), 2D (2 days), or 1W (1 week).
- Slider. Drag the slider to choose any length of time from 30 minutes up to 2 weeks. The label to the right of the slider shows what you have selected, such as "1 week, 7 hours." The charts update as you drag.

Tip
Longer durations take longer to load. The Log is the slowest to fill in.
Storage
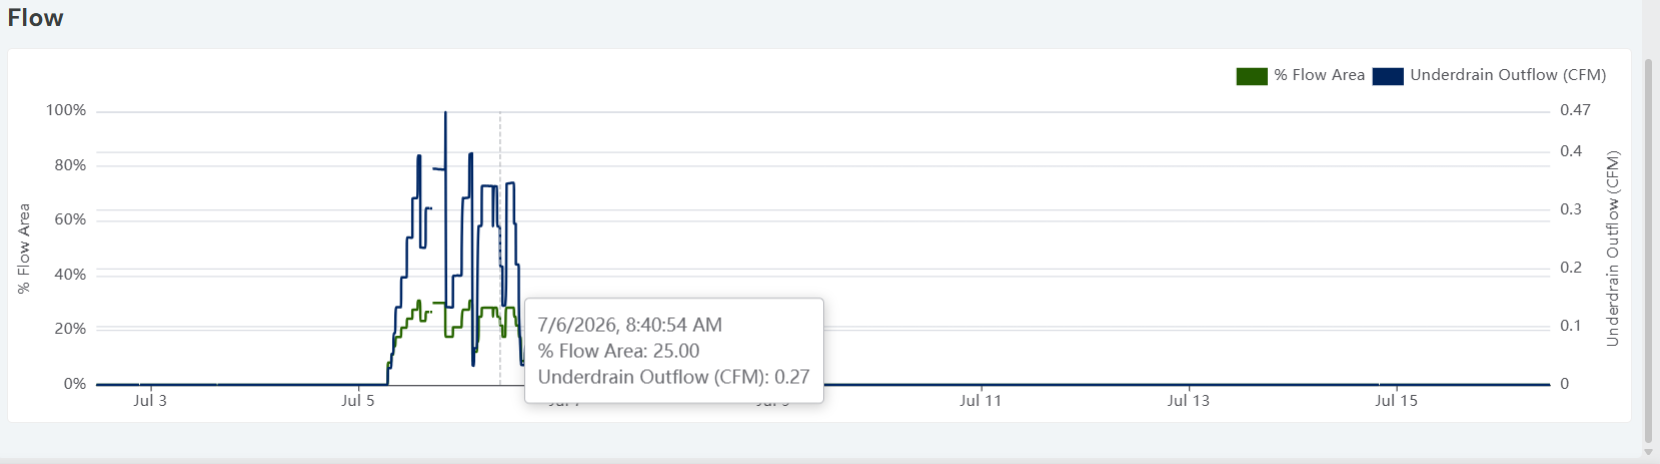
The Storage tab shows how Opti Control understands and is managing your facility's storage. Move your cursor over a chart to inspect values at a specific point in time.
As you move across the chart:
- A tooltip displays the exact timestamp and value(s) at the cursor position.
- A red dashed vertical reference line marks the corresponding point on the timeline.
If a chart contains multiple data series, such as % Open and Underdrain Outflow, the tooltip displays the values together at that timestamp.
Show or Hide Data Series
Click the colored box next to a series name in the upper-right corner to show or hide it.
Log
The Log tab provides a record of recent operations at the facility, including user actions with remote control, system commands to change the control target, and alarm activity. Each entry includes:
- Time the event occurred
- Source of the event (System or a named user)
- Description of the action or event
Use the filter buttons (All, User, Alarm, and System) to display only specific types of events. Click the arrow on an entry to expand it and see additional detail, such as the exact before-and-after values of the change.
The Log respects the Duration setting above, so a longer duration shows more history, though it may take longer to load.
Forecast
The Forecast tab shows expected precipitation for the site, combining Quantitative Precipitation Forecast (bars) and Probability of Precipitation (line).
The shaded Storm Forecast Duration band marks the 24-hour window of an incoming storm. The horizontal threshold lines, Dry Period QPF Threshold and Dry Period POP Threshold, show the precipitation and probability configuration used to consider whether forecast precipitation is significant enough to act on.
Use the Selected Time slider at the bottom to move through the forecast window; the date shown above updates to match.
Connectivity
The Connectivity tab shows how much of each time block the site was online versus offline. Hover over a bar to see the exact time range it covers along with the % Online and Offline during that block.
Camera
If a camera is installed, the Camera tab allows viewing of time-lapse photos. Alongside the sensor data on the Storage tab, cameras provide remote verification of facility conditions.
Notes
The Notes tab allows users to view and add operational notes for the facility. This provides a centralized place for documenting important information and observations related to the site's operation. For example, some communities have specific manual control contingency plans that they record here so that anyone using Remote Control can find them. Another use case is describing background information about the project.
The Notes tab supports a subset of Markdown text, including:
- Headings
- Bold
- Italics
- Tables
- Lists
- Links
-
Blockquotes
Note that images and HTML are not supported.
Data Explorer
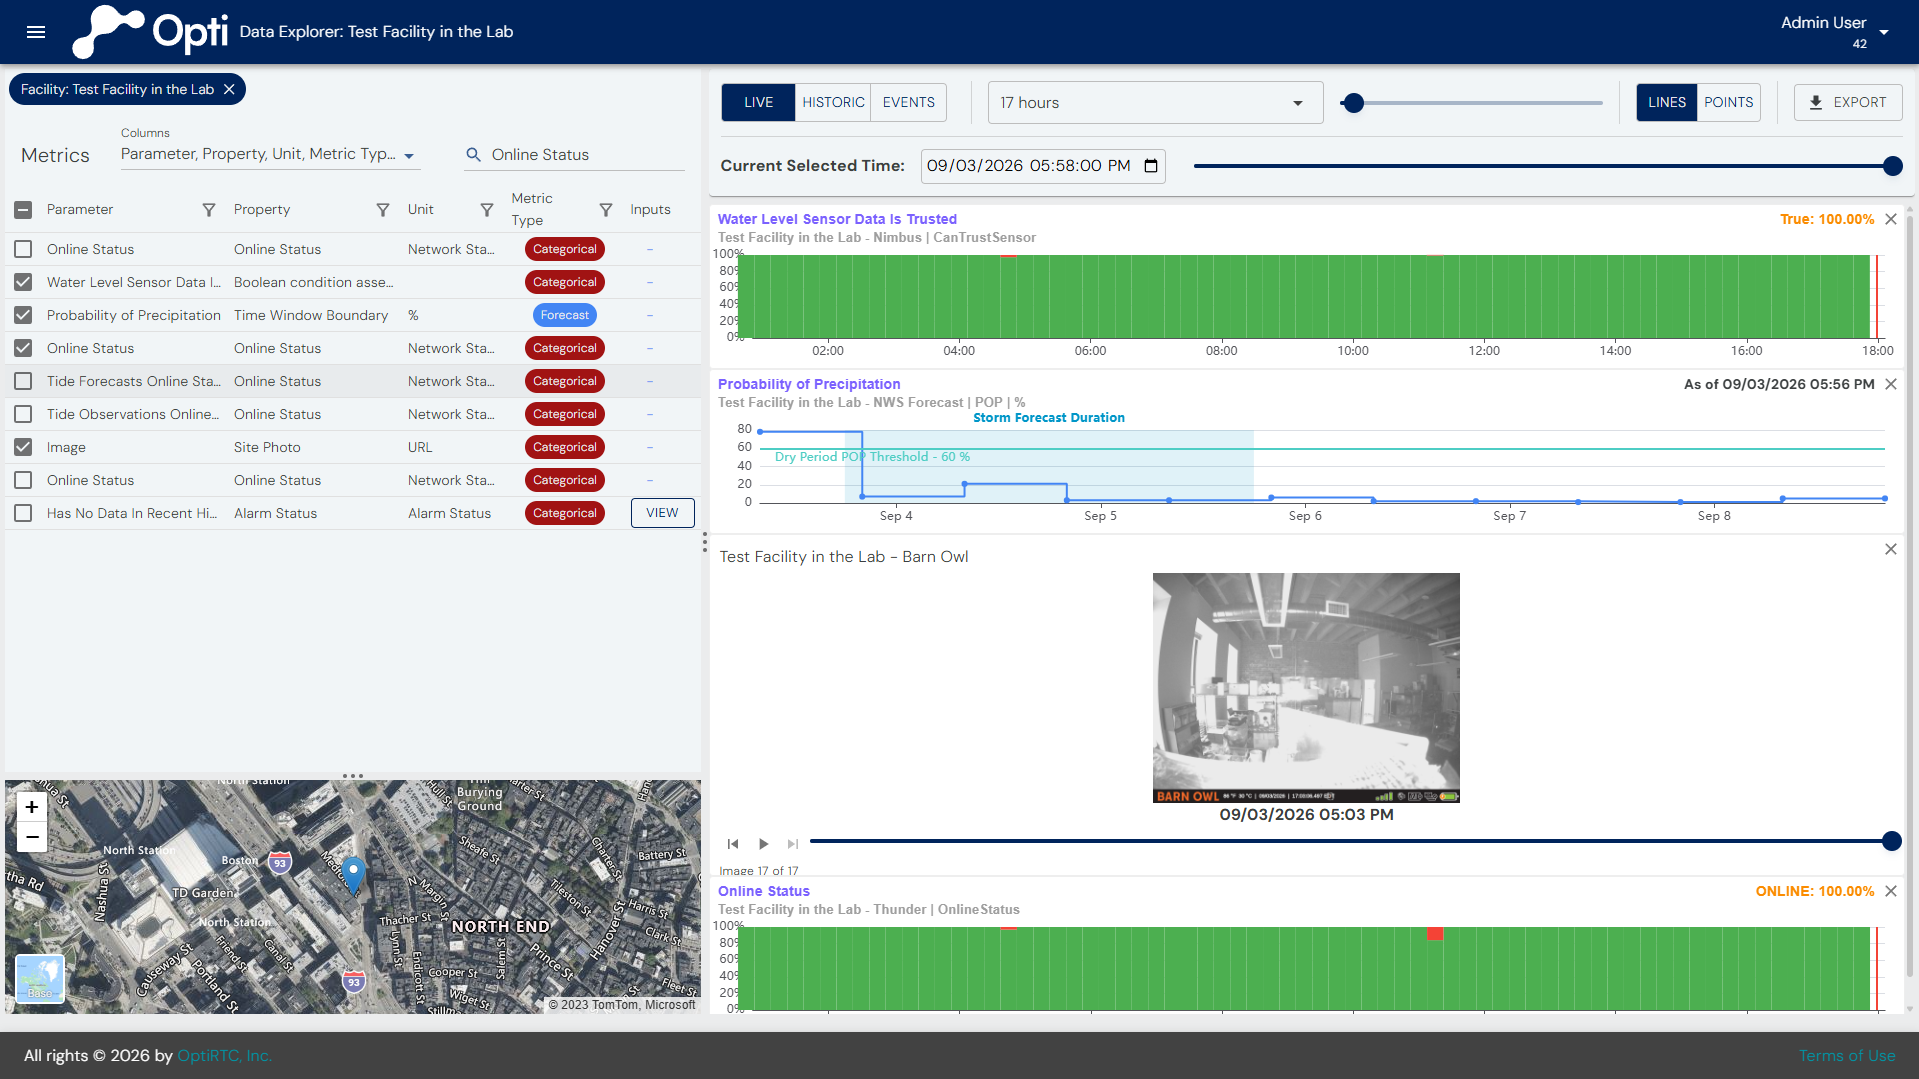
Data Explorer helps you explore, visualize, and export operational data from your Opti deployment, and analyze when events and measures occurred relative to each other. Use it to analyze trends, investigate events, compare facilities, and share or export data. Data Explorer provides access to live and historic data of all inputs and calculated metrics configured in an Opti Account.
Data Explorer Layout
The Data Explorer is divided into four primary work areas:
- Metrics Table: Browse and select the data you want to analyze.
- Time Controls: Choose the time period and navigate through data.
- Chart Pane: Visualize and compare selected metrics.
- Map View: View the location of the selected facility.
Metrics Table
The Metrics table lists all data from available sensors, forecasts, and calculated values for the selected facility. Use the table to quickly locate the data you want to view.
Customize Columns
Select the Columns dropdown to choose which metadata columns are displayed in the Metrics table. Showing only the columns you need makes it easier to find and compare metrics.
Available columns include metadata such as Facility, Process, Parameter, Property, Unit, Data Type, and Source.
Filter and Search Metrics
Use the Search box to quickly locate metrics by name. You can also filter individual columns to narrow the list based on the selected metadata.
Select Metrics
Select the checkbox beside a metric to display it in the Chart Pane. Multiple metrics can be selected and compared simultaneously.
View Derived Metrics
Some metrics are calculated from one or more source metrics. Select View in the Inputs column to display the underlying metrics used to generate the selected calculation.
This makes it easy to understand how derived values are calculated without losing your place in the table. Click the X on the "Inputs for" chip next to your Facility name to return to searching for new metrics. See Understand Derived Metrics for further explanation of derived metrics.
Time Controls and Views
The Time Controls determine the data displayed in the Chart Pane.
Select a Time Mode
Choose from:
- Live – View the most recent data (default).
- Historic – Analyze a specific date and time.
- Events – Review specific recorded rainfall or CMAC events bookmarked by the system.
Regardless of the selected mode, the charts and metrics update automatically to reflect the selected time period.
Live View
Use Live mode to analyze data from recent conditions.
The time range can be adjusted using:
- Preset time range dropdown for intervals of 30 minutes, 1 day, 2 days, or 1 week.
- Time range slider for times in 30-minute intervals up to 2 weeks.
The Current Selected Time field allows you to inspect a specific moment within the selected time range. When the selected time changes:
- A red reference line appears on every chart.
- Values in the upper-right corner of each chart update to the value at that point in time.
This makes it easy to compare metrics at the same instant.
Historic View
Use Historic mode to analyze data from a specific range of dates and times.
Specify:
- From date and time (Start)
- To date and time (End)
Charts update to display data for the selected time period. Historic mode includes the Current Selected Time control.
Event Explorer (Event View)
Select Events to analyze individual rainfall or CMAC events instead of manually selecting dates.
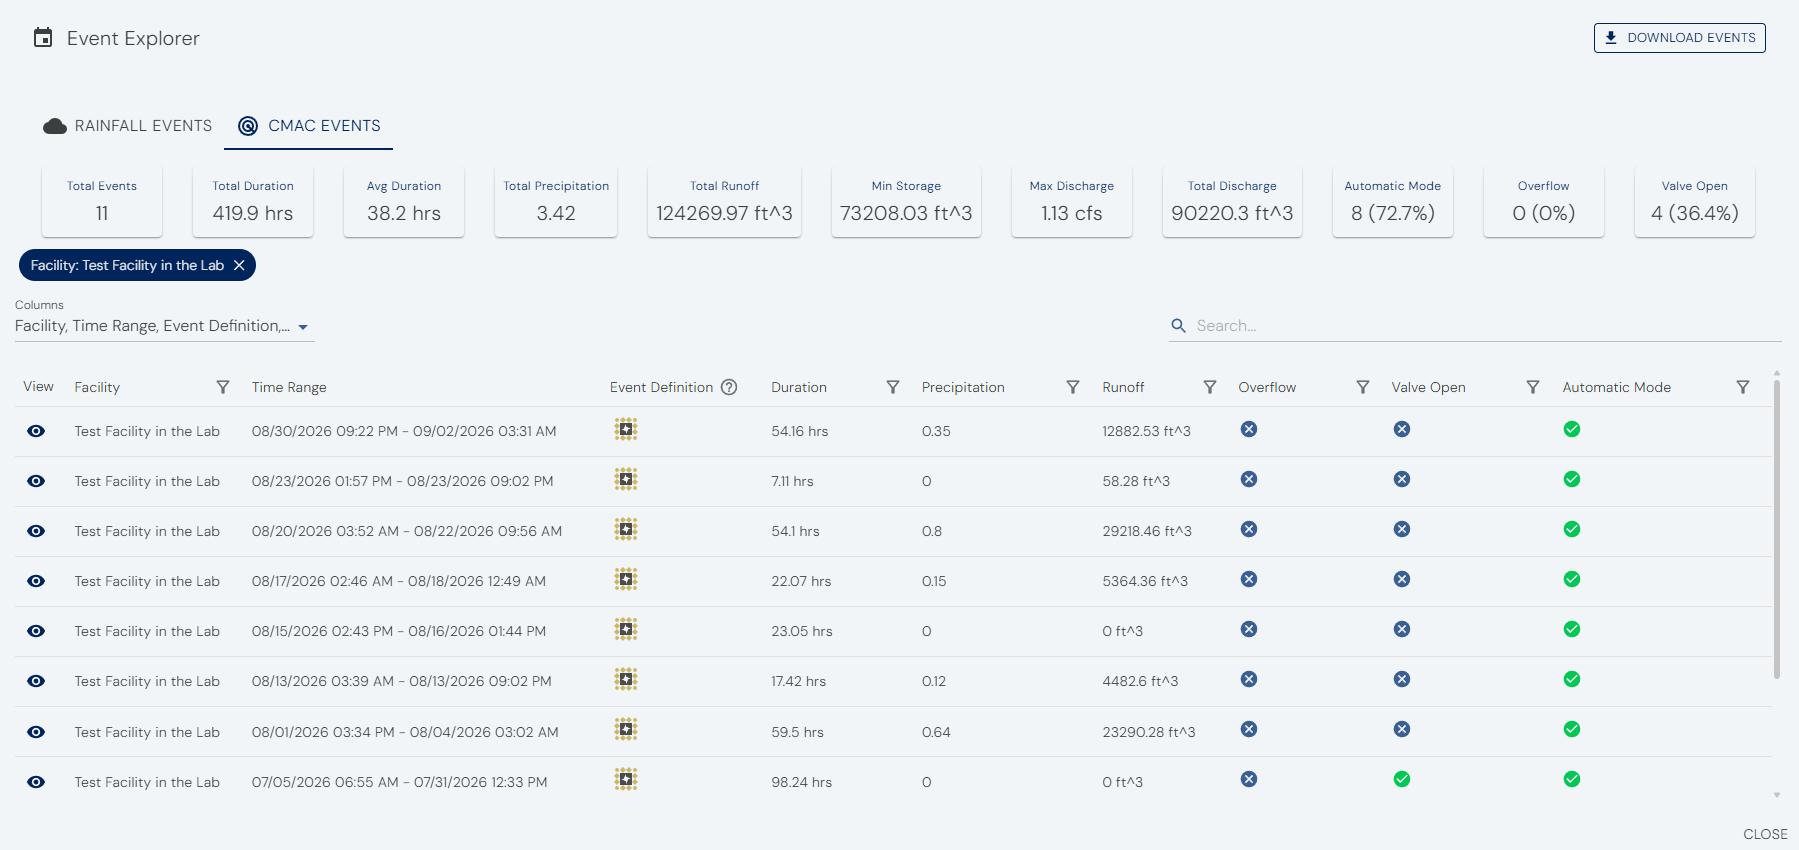
The Event Explorer lists all recorded events for the selected facility, summarizes metrics across all events in view, and provides tools for filtering, reviewing, and reopening events.
Event Types
Choose between:
- Rainfall Events: Periods of wet weather.
- CMAC Events: Periods when the CMAC system took an action.
Event Summary
Summary cards at the top of the window provide key statistics for the selected facility.
Statistics update automatically as filters are applied and may include:
- Total Duration
- Total Precipitation
- Total Runoff
- Valve Open Time
Filter Events
Use the table filters and search controls to quickly locate specific events. The Columns menu can also be used to customize which information is displayed.
Event Definitions
The Event Definition column identifies the criteria used to determine when an event begins and ends.
Click the ? icon to view the complete definition history, including:
- The event definition
- First Seen
- Last Seen
- Total Events
This history preserves the logic used to classify historical events, even if event definitions change over time.
Open an Event
Click the View (eye) icon beside an event to return to the main Data Explorer view.
The selected event's time range is automatically loaded, allowing you to analyze your previously selected metrics during that event. This provides a quick way to investigate rainfall events or CMAC actions without manually setting the time range.
Download Events
Click the Download Events button in the upper-right corner of the Event Explorer panel to download all events that occurred for the selected site. Use the Columns tab to select the desired data from the events.
Chart Pane and Analysis
The Chart Pane displays selected metrics over the chosen time range, allowing you to compare system conditions, investigate events, and analyze system performance.
Compare Metrics
Display multiple metrics simultaneously to identify relationships between system conditions and system operation.
The Data Explorer automatically selects the most appropriate chart type for each metric:
- Line charts display continuous measurements such as water level, flow, rainfall, or storage.
- Bar charts display categorical or state-based metrics such as operating modes or equipment status.
Viewing related metrics together makes it easier to understand how changes in one metric correlate to another.
Inspect Values at a Specific Point in Time
Use the Current Selected Time slider or date/time selector to examine conditions at an exact moment.
As selected time changes:
- A red reference line appears across every chart.
- All charts remain synchronized to the selected timestamp.
- The value shown in the upper-right corner of each chart updates to the value at that point in time.
This allows exact comparison of multiple metrics at any point in time. For example, you can determine the rainfall, storage volume, release rate, and system operating mode at the same instant during a storm.
Explore Charts
Move your cursor over any chart to inspect data without adjusting the selected time. The red reference line will follow your cursor and chart values update automatically.
This allows you to investigate trends and compare multiple metrics interactively.
Change Chart Display
Use the Lines and Points buttons to change how data is displayed. Both Lines and Points can be selected at the same time.
Remove a Chart
Each chart includes a Close (x) button in the upper-right corner to remove it from the Chart Pane. This does not remove the metric from the Metrics table, and the chart can be added back by selecting the metric again.
Understand Derived Metrics
Derived Metrics are derived values, meaning they are calculated from one or more underlying inputs rather than being measured directly.
Understanding a metric's inputs can help explain how calculated values are produced and assist when validating data or troubleshooting unexpected results.
Export Data
Data Explorer can export selected, non-forecast metrics to a CSV file. Exports are processed in the background, allowing you to continue using the portal while the file is prepared.
Use the following procedure to export data from Data Explorer. Start by selecting data to export:
- In Data Explorer, select the metrics you want to export.
- Set the desired data window using the Data Explorer time controls.
- Select Export from the toolbar.
Note
The Export button is available only when at least one non-forecast metric is selected. Forecast metrics are not included in exports.
Export Data Dialog
In the Export Data dialog, configure the following options to finish defining the file you will export:
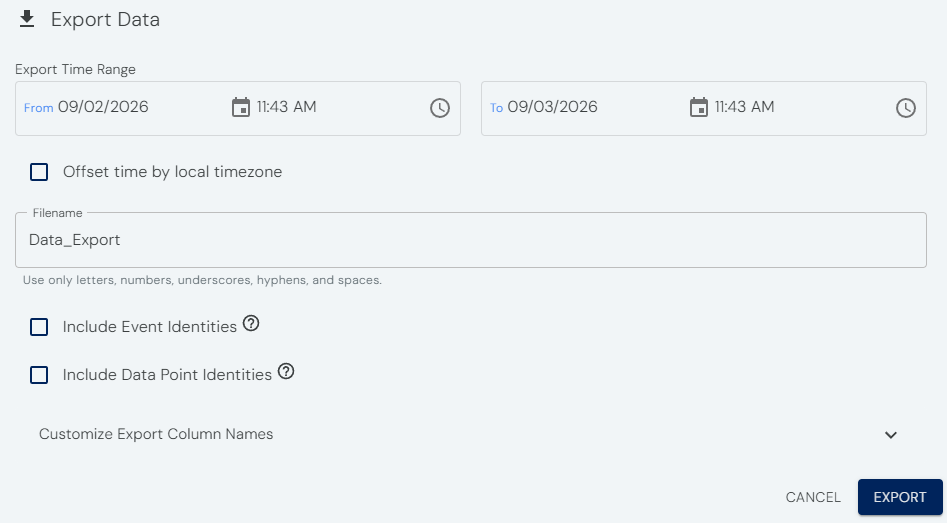
- Export Time Range: Set the From and To dates and times. The current Data Explorer window is used as the default.
- Offset time by local timezone: Enable this option to shift exported timestamps by the displayed UTC offset. Leave it disabled to export timestamps in UTC.
- Filename: Enter the CSV filename without the .csv extension. The filename may contain letters, numbers, spaces, underscores, and hyphens.
- Include Event Identities: Adds event identifiers to rows that occurred during known events.
- Include Data Point Identities: Adds a data-point identifier alongside each exported timestamp.
Optionally, expand Customize Export Column Names to take granular control over how the columns will be named in your exported file. When you are finished, select Export to submit the data export request to the Opti Platform. A confirmation appears when the request has been submitted. Export processing continues in the background, and you will receive an email confirmation when it has completed.
Customize Export Column Names
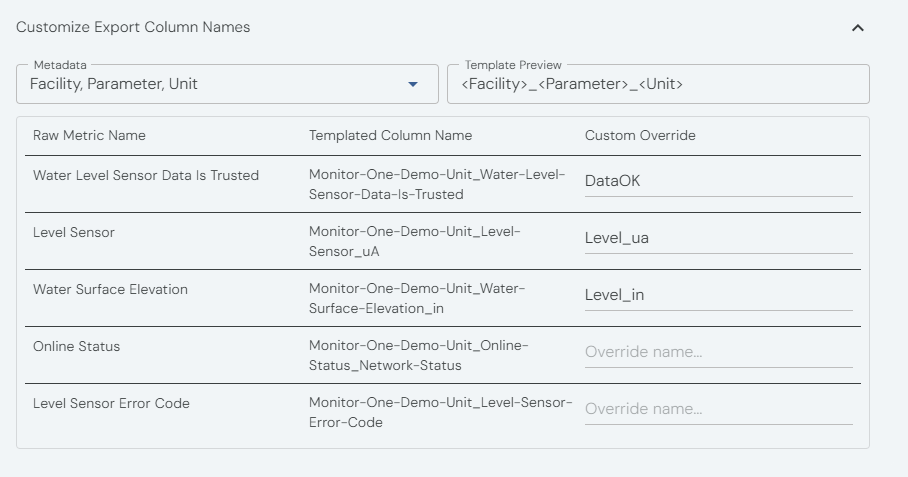
By default, metric column names are generated from the metric's Facility, Parameter, and Unit metadata. To customize the headings:
- Expand Customize Export Column Names.
- Use the Metadata list to select the fields used to generate each heading. Available fields include Network, Facility, Process, Parameter, Parameter Name, Property, Description, Unit, Metric Type, Data Type, and Source.
- Review the generated format in Template Preview.
- Enter a Custom Override for any individual metric that requires a different heading.
Each resulting column name must be present and unique. A warning identifies generated names containing inherent hyphens so that you can override them if needed. The Export button remains unavailable while any column name is invalid or duplicated.
Download the Completed Export
After submitting an export, a Downloads button appears in the portal header. A badge shows the number of exports currently being processed. To download a completed export, follow these steps:
- Select the Downloads button.
- Review the export status:
- In Progress: The CSV is still being prepared.
- Complete: The CSV is ready.
- Failed: The export could not be completed.
- When the status is Complete, select the Download icon in the Actions column.
- Optionally, select the Remove icon to hide a completed export from the Downloads list.
The downloaded file uses the configured filename with a .csv extension.
Share Analysis
The Data Explorer automatically saves your current workspace in the page URL. As you interact with the Data Explorer, the URL updates to reflect your current view.
Sharing this URL allows other users with access to the same deployment to open the Data Explorer with the same analysis already loaded. This makes it easy to collaborate with team members, investigate events together, or reference a specific analysis without recreating the workspace manually.
Managing Alerts
Opti can send email alerts when important conditions or events occur at your sites. Alerts help keep users informed of weather, system status, and critical conditions.
Alerts are organized into three categories:
| Category | Description |
|---|---|
Weather |
Weather events and forecasts. |
Status |
Site condition updates. |
Critical |
Urgent information about risks to facility safety and performance. |
Alert Settings
Three settings determine whether a user receives an alert.
| Setting | Description |
|---|---|
Receiving |
The user is selected to receive a specific alert. |
Subscribed |
The user is subscribed to the alert category (Weather, Status, or Critical). |
Active |
The alert is enabled by an Account Administrator. |
A user only receives an alert when all three conditions are met: Active, Subscribed, and Receiving.
Manage Alerts (Administrators)
The Alerts page allows Account Administrators to manage alert notifications for users across their deployments using the Alerts by Deployment or Alerts by Users tabs. Changes made but not yet saved on one tab are reflected in the other, making it possible to verify changes from either perspective.
Administrators can:
- Enable or disable alerts.
- Choose which users receive each alert.
- Review pending changes before saving.
- View the alert change history.
Alerts by Deployment
Use the Alerts by Deployment tab to manage alerts for a specific deployment.
- Turn alerts
ActiveorInactive. - Select which users receive each alert.
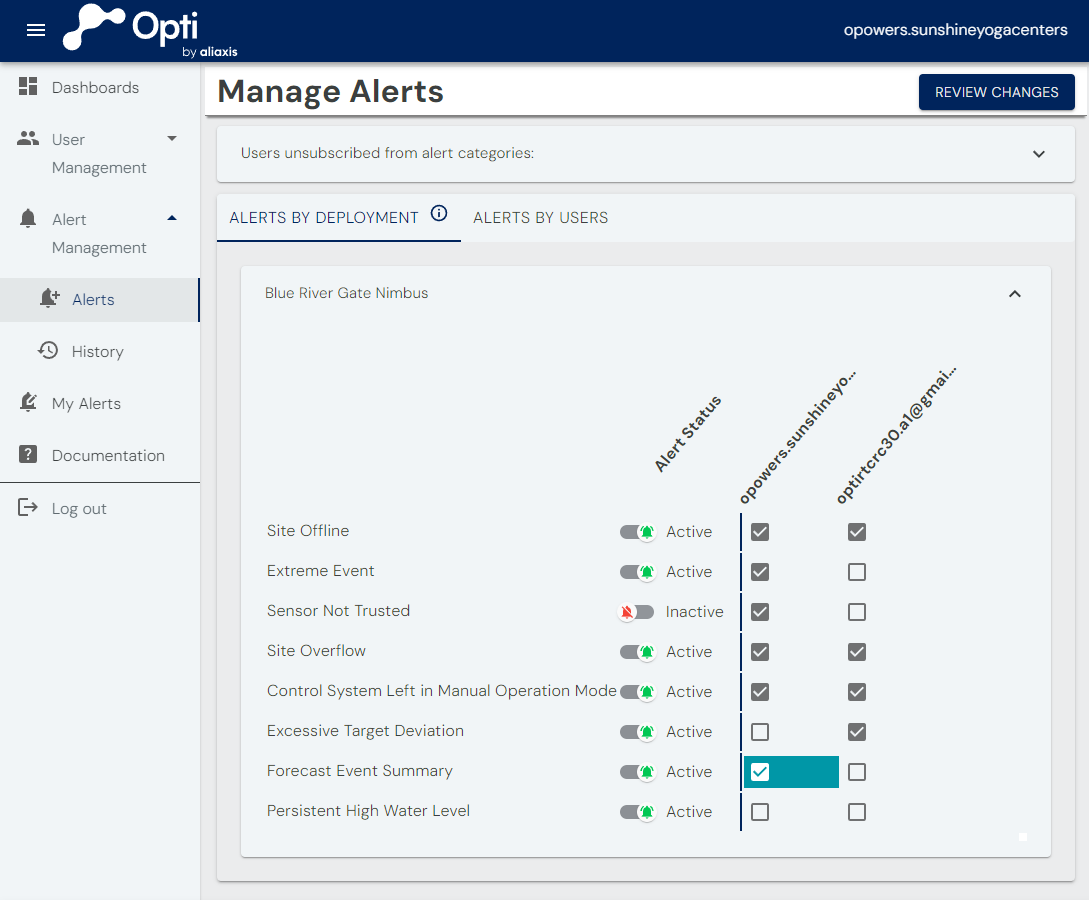
Active or Inactive for all users, while checkboxes control which users are Receiving individual Alerts.Alerts by Users
Use the Alerts by Users tab to view all alerts assigned to an individual user. This view makes it easy to verify a user's alert configuration across multiple deployments.
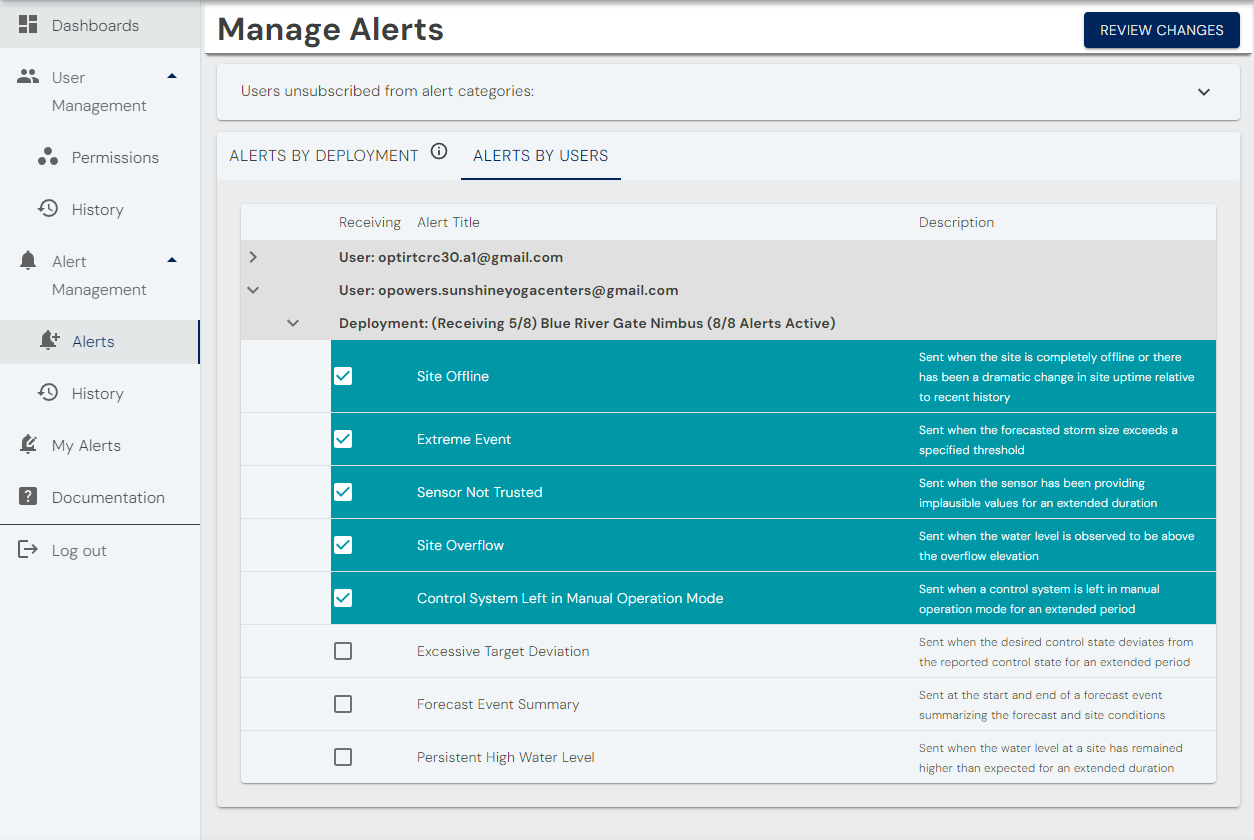

Note
Before a user can be sent an Alert email from the Opti Platform, they must first sign in and accept the Terms of Service. The user interface prevents users from becoming Alert recipients before they have been invited to a Network that owns the relevant Deployment.
Warning
Users must consent to receive notifications from automated systems. By using Opti's Alert Management, Administrators indicate that they have the consent for each email address they configure to receive Opti Alerts.
Saving Changes
After making changes:
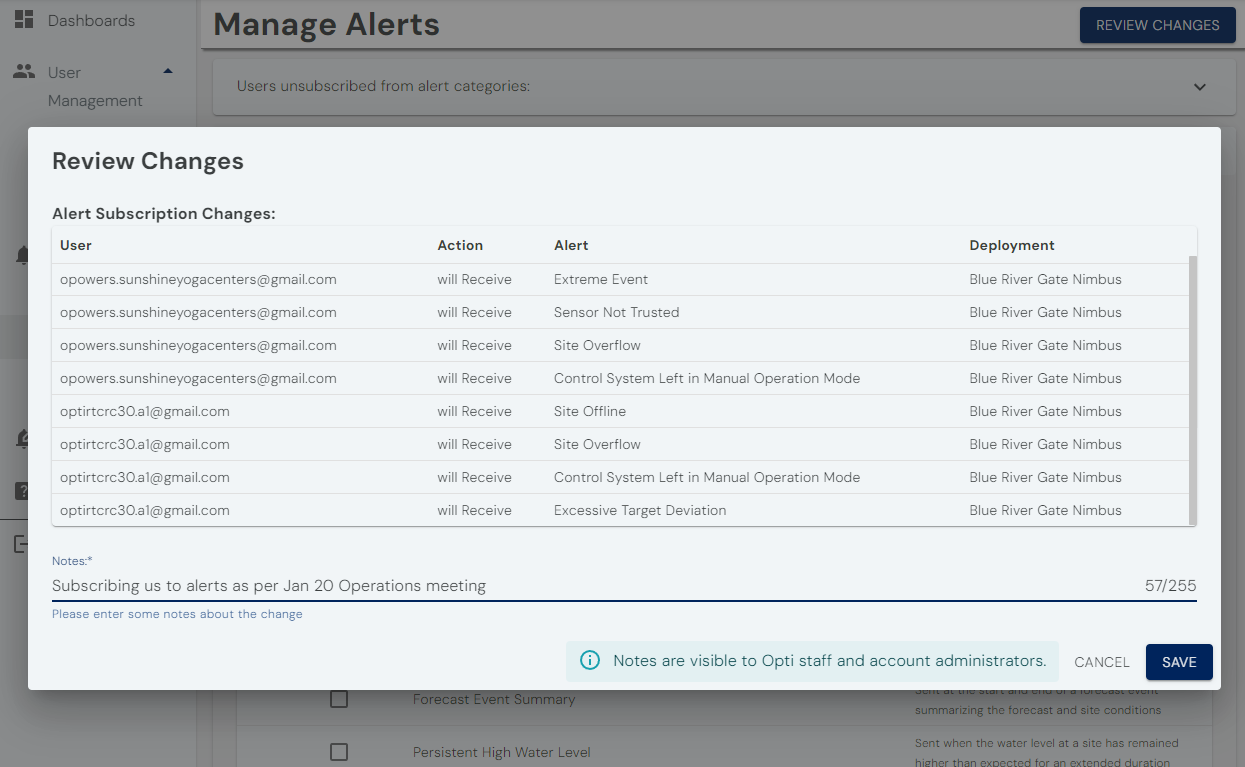
- Click Review Changes
 .
. - Review the pending updates.
- Enter notes to explain the changes.
- Click Save.
Changes are recorded in the Alert History.
Alert History
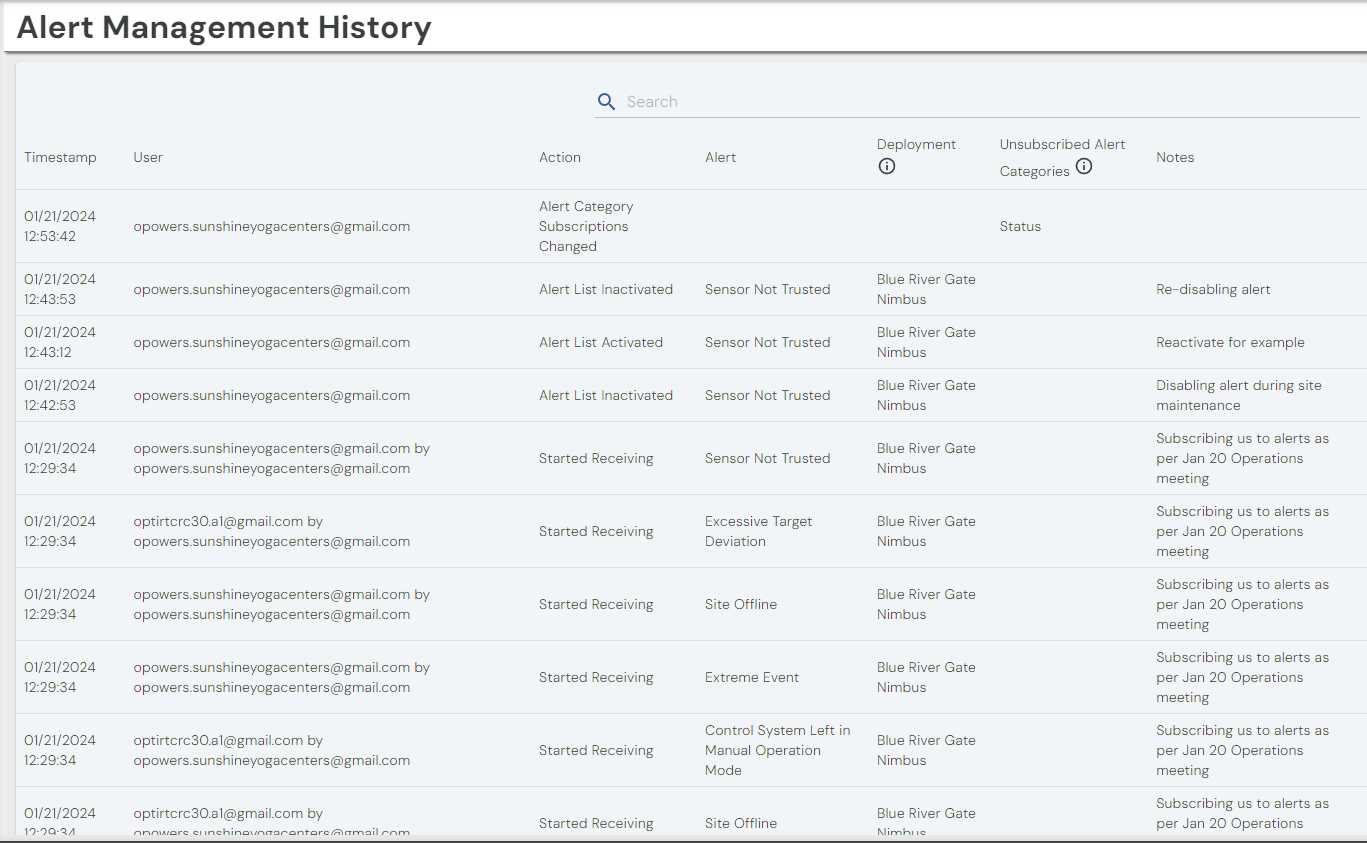
The Alert History page records all administrator changes to alert configurations. If someone should have received an email about an on-site event but did not, this page can show you if their configuration was changed. Use this page to review:
- who made a change,
- what changed,
- when the change occurred.
Note
The Alert History will not show that a removed user has stopped receiving alerts. Instead, the User Management History will show that the user was removed from the impacted Networks at that point in time.
My Alerts
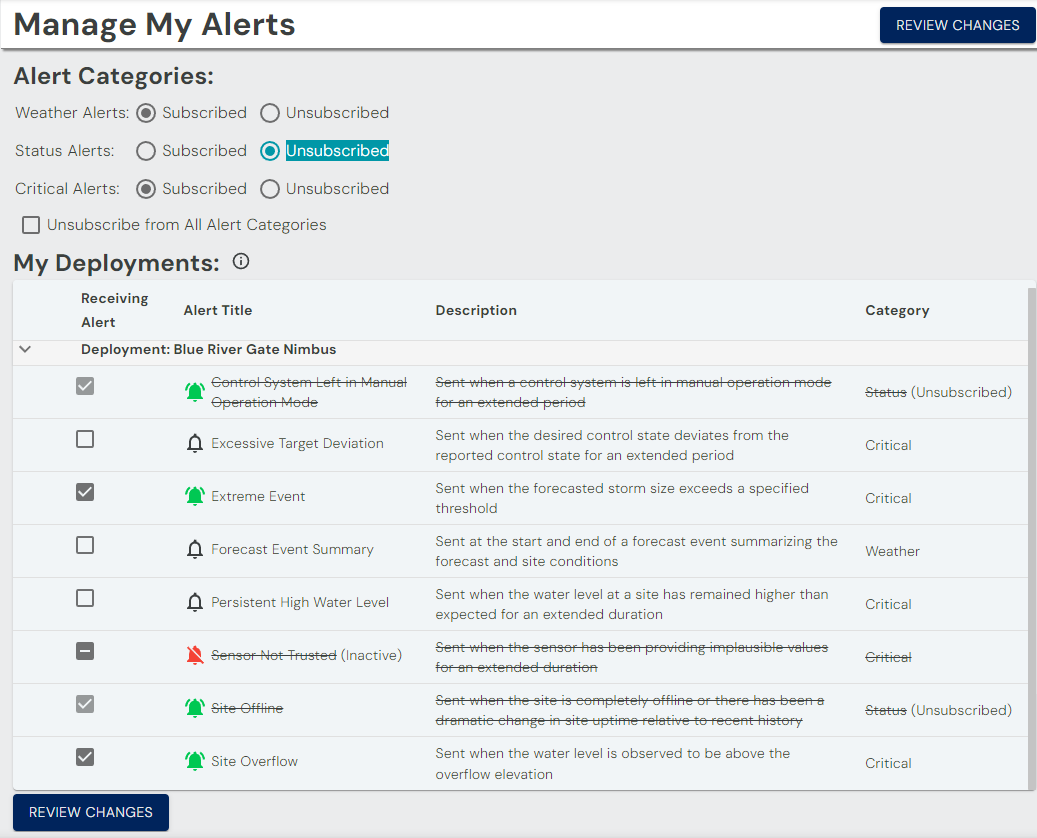
The My Alerts page allows any user to manage the email notifications they receive.
Users can:
- Subscribe or unsubscribe from alert categories.
- Enable or disable individual alerts in the My Deployments tab.
- Toggle on or off by clicking the checkbox.
- Review alerts that have been disabled by an administrator.
- A bell will appear red with a line through it if an Alert you are
Receivinghas been set toInactiveby an Administrator. - Hover over the bell to see a summary of the exact alert status in a tooltip.
- A bell will appear red with a line through it if an Alert you are
Saving Changes
After updating your alert preferences:
- Click Review Changes .
- Review the pending updates.
- Click Save.
Note
Account Administrators are notified via email when a user changes the Receiving status of an Alert or unsubscribes from an Alert category.
Feedback
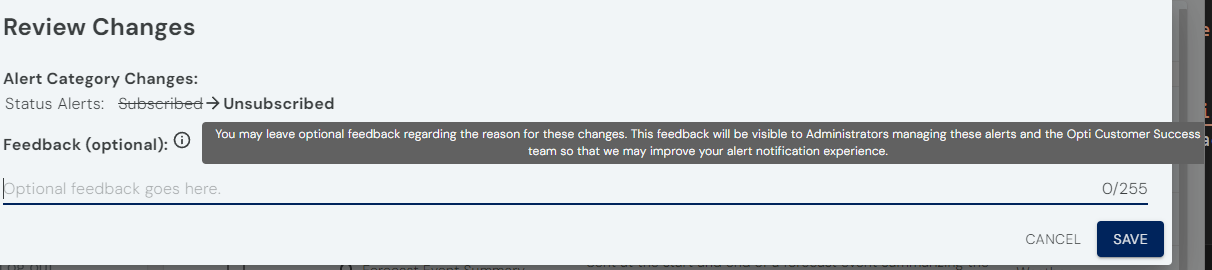
When saving changes on the My Alerts page, you can optionally include feedback explaining why you updated your alert preferences. Your comments are shared with your Account Administrators and the Opti Customer Success team to help improve your alert experience.
Alerts are intended to save you time, so if an Alert is sending emails that are not helpful, please let us know!
One-Click Unsubscribe
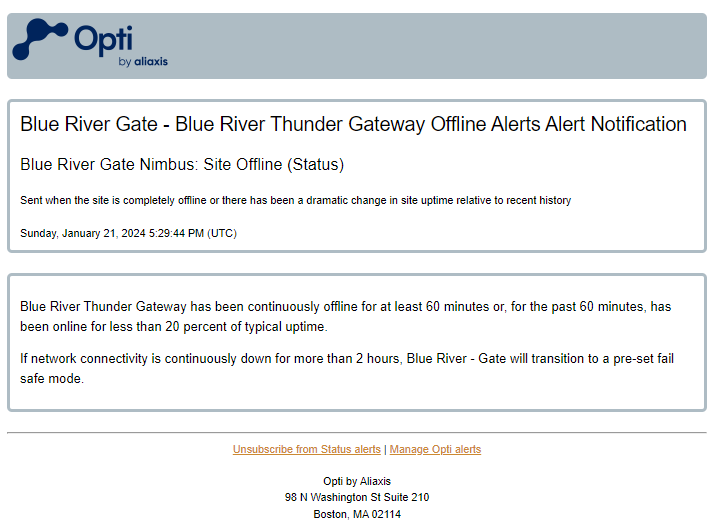
In addition to being able to subscribe and unsubscribe from alert categories on the My Alerts page, the Opti Platform supports the IETF's One-Click Unsubscribe specification, which allows Alert email recipients to unsubscribe from all Alert emails in an alert category by mechanisms in their email client. To re-subscribe to an alert category, use the controls at the top of the My Alerts page.
Note
Account Administrators are notified via email when a user unsubscribes from an alert category via One-Click Unsubscribe.
User Permissions
Access to Opti dashboards and other features of the platform is strictly controlled. Users cannot request access directly from a public interface without an invitation. The invite-only model ensures that only authorized individuals have access to system-related data and functionalities.
Account Administrators manage user access from the Permissions page under User Management. From this page, administrators can:
- Invite users to a Network.
- Assign or change user roles.
- Remove users from a Network.
- Search or export current permissions.
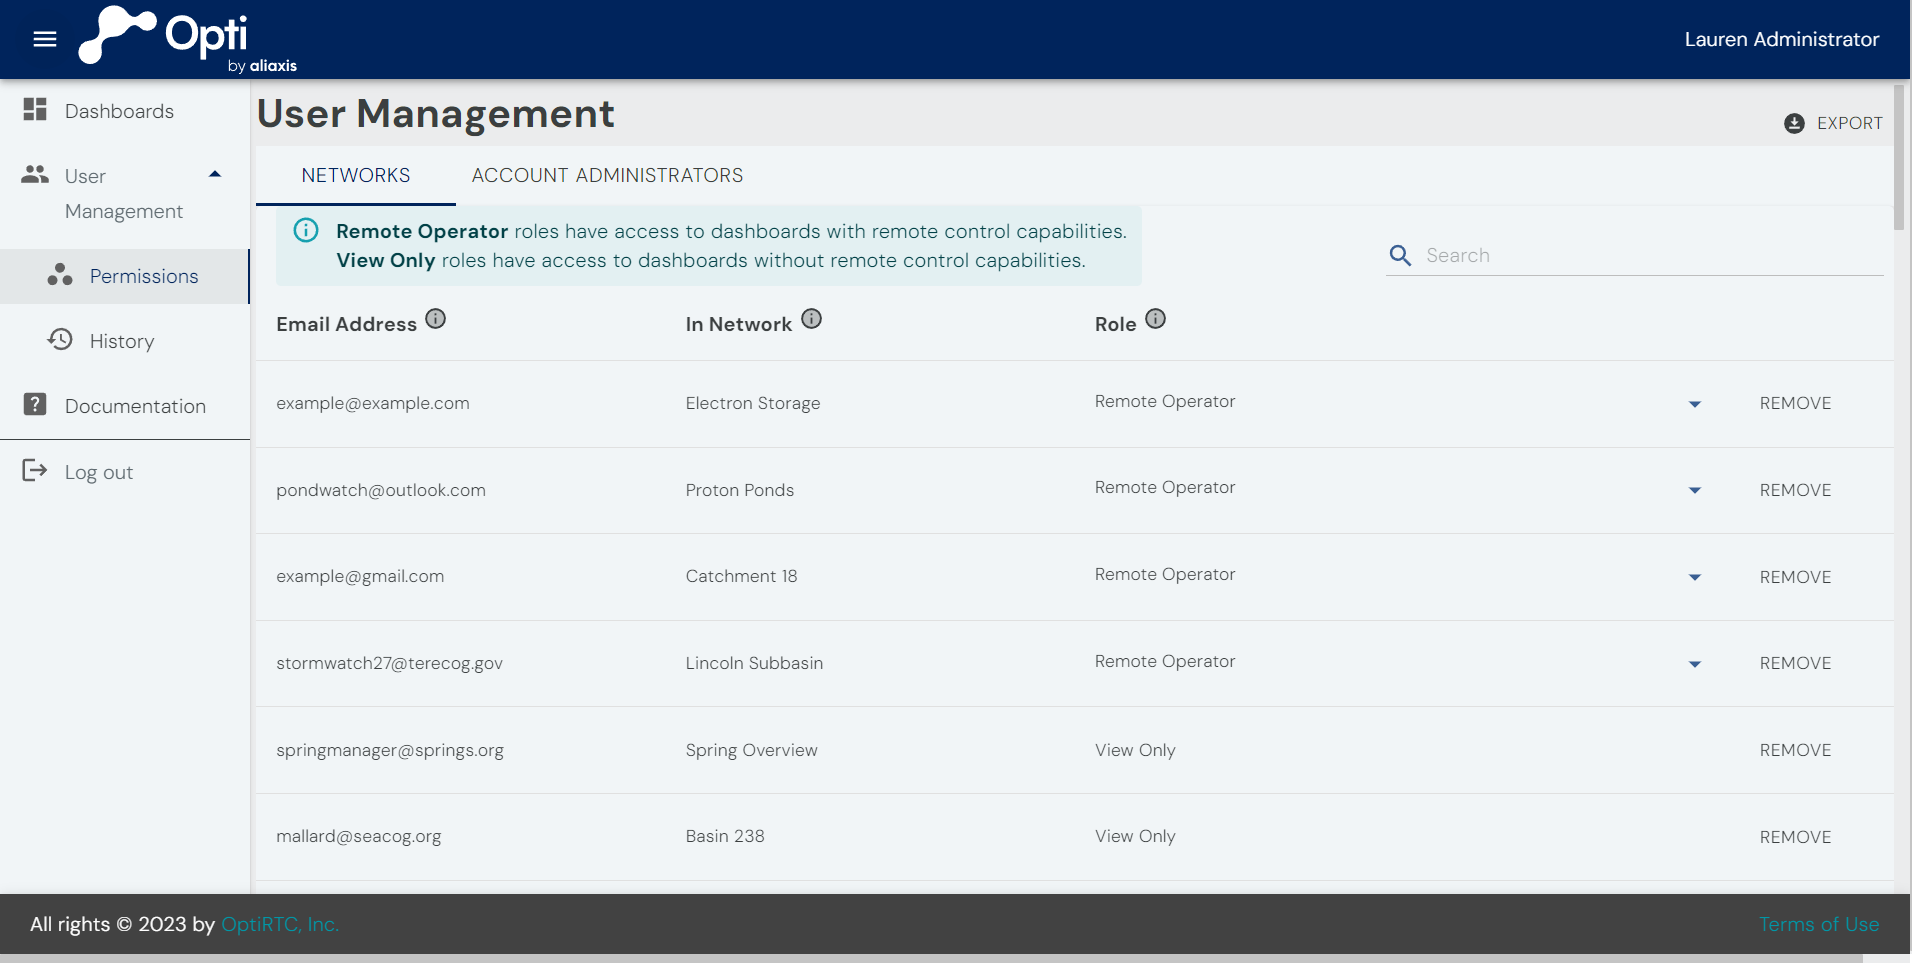
The Networks tab displays the current permissions for all users in the Networks you administer. Hover over the  icon for a description of each column.
Add a User to a Network
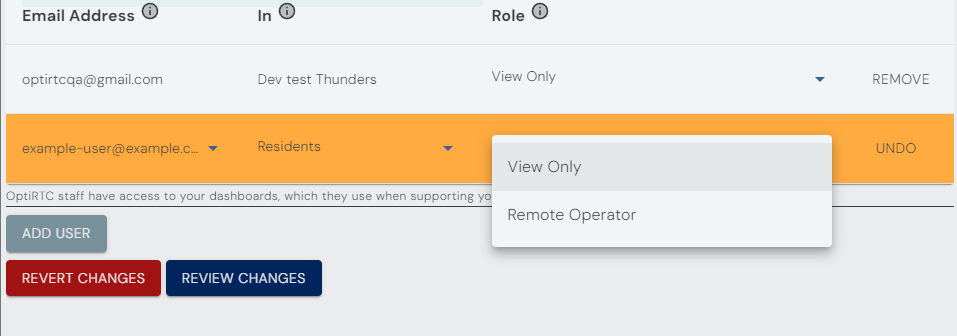
- Click Add User.
- Enter the user's email address.
- Select a Network and Role.
- Click Review Changes.
- Add a note and click Save.
Info
Users can be internal or external to your organization. You, as the Account Administrator, are in charge of what access they have to the dashboards and other resources in your Opti Account. Opti supports Microsoft Entra ID (Azure AD), Outlook, and Gmail accounts. Invited users with other email providers will be prompted to create a personal Outlook account during their first sign-in.
Note
By inviting users, you are implying that you have their permission to invite them to use the Opti Platform. Do not invite someone who has stated they do not want to receive such an invitation.
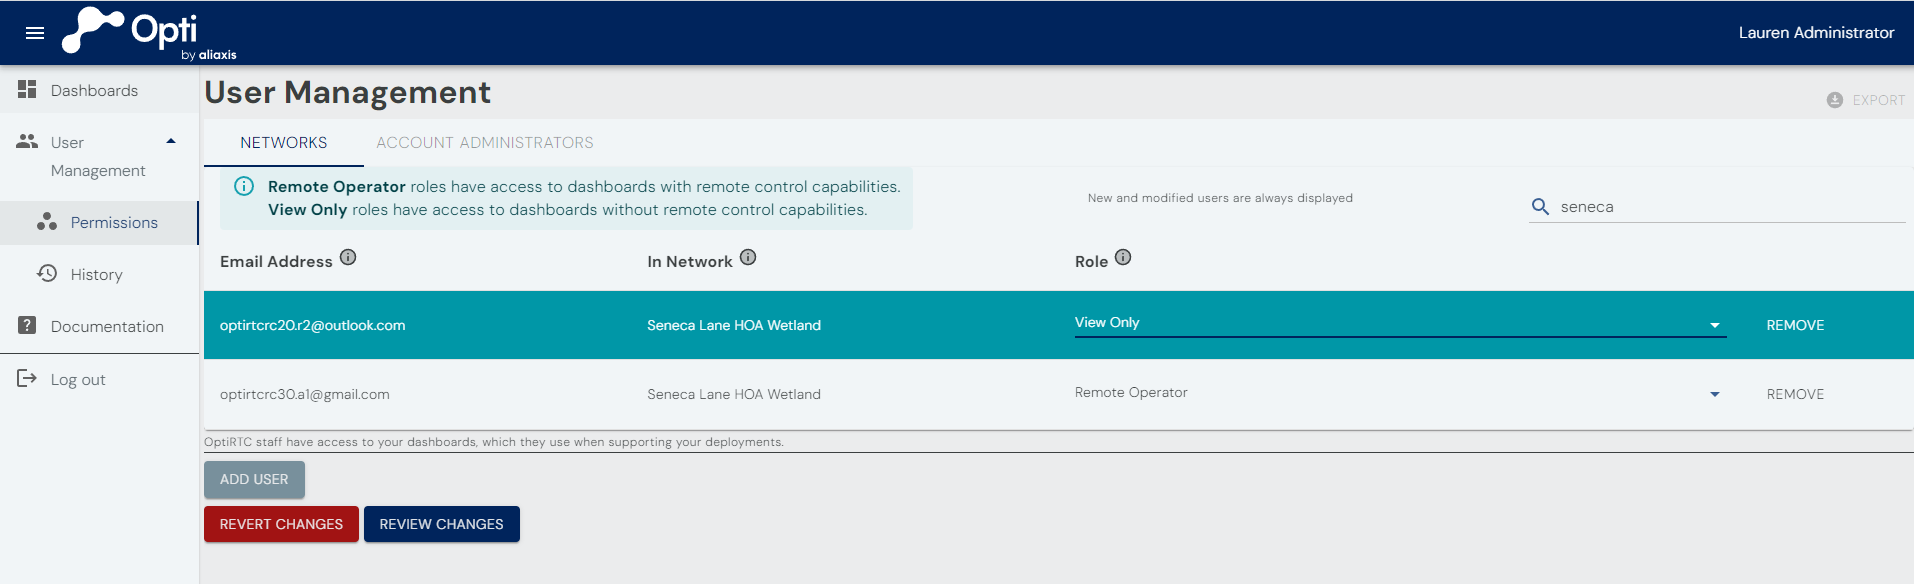
Change a User's Role
Users can be assigned one of two roles:
- Remote Operator – Can monitor dashboards and use remote control features.
- View Only – Can monitor dashboards but cannot use remote control features.
To change a role:
- Select a new role from the Role dropdown.
- Click Review Changes.
- Add a note and click Save.
Changes and notes are recorded in the History page. The user then receives an email summarizing any updated roles and any Networks or Accounts they are losing access to entirely.
Remove a User from a Network
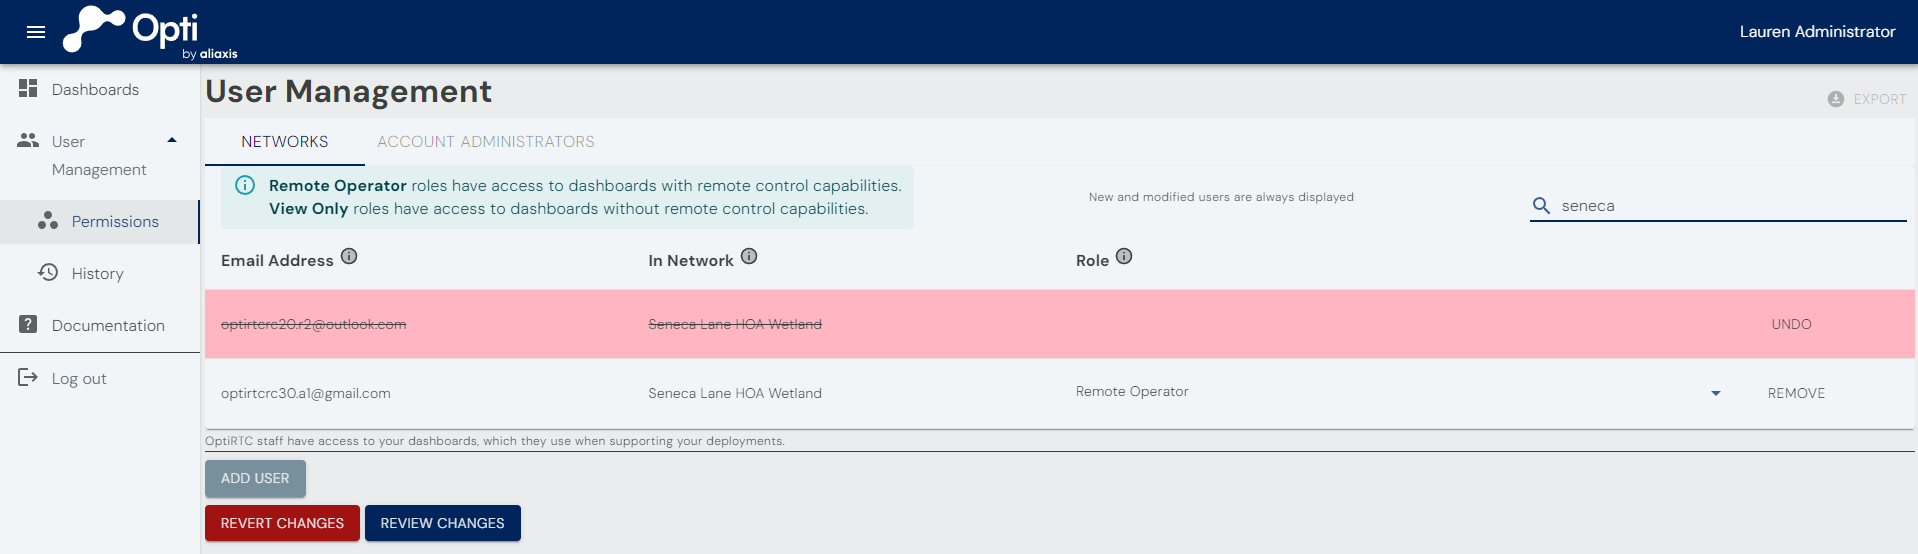
Administrators can revoke a user's access to some or all of the Networks those users can access. Click the Remove button on the right side of the Networks tab to indicate you intend to remove that user's access to that specific Network. As with adding a new user, click Review Changes, add a note, and then click Save to commit the change to the Opti Platform.
Filter Permissions
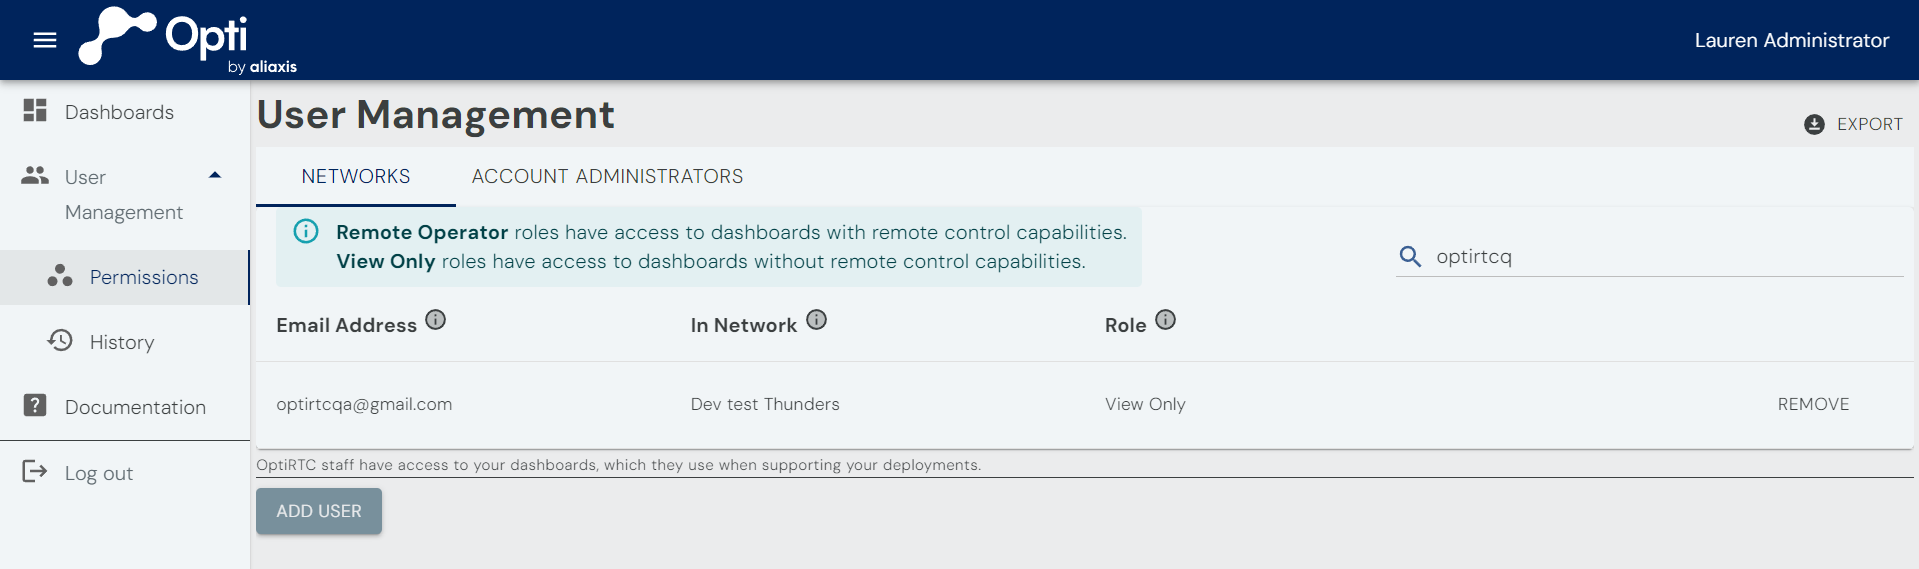
Administrators can use the Search box to filter the rows they see. This can be helpful for answering specific questions related to access, such as "who has access to the dashboard for the newly-deployed site?"
Export Permissions
Click Export  in the upper-right corner to download a CSV containing the current user permissions for all Networks the signed-in Administrator manages.
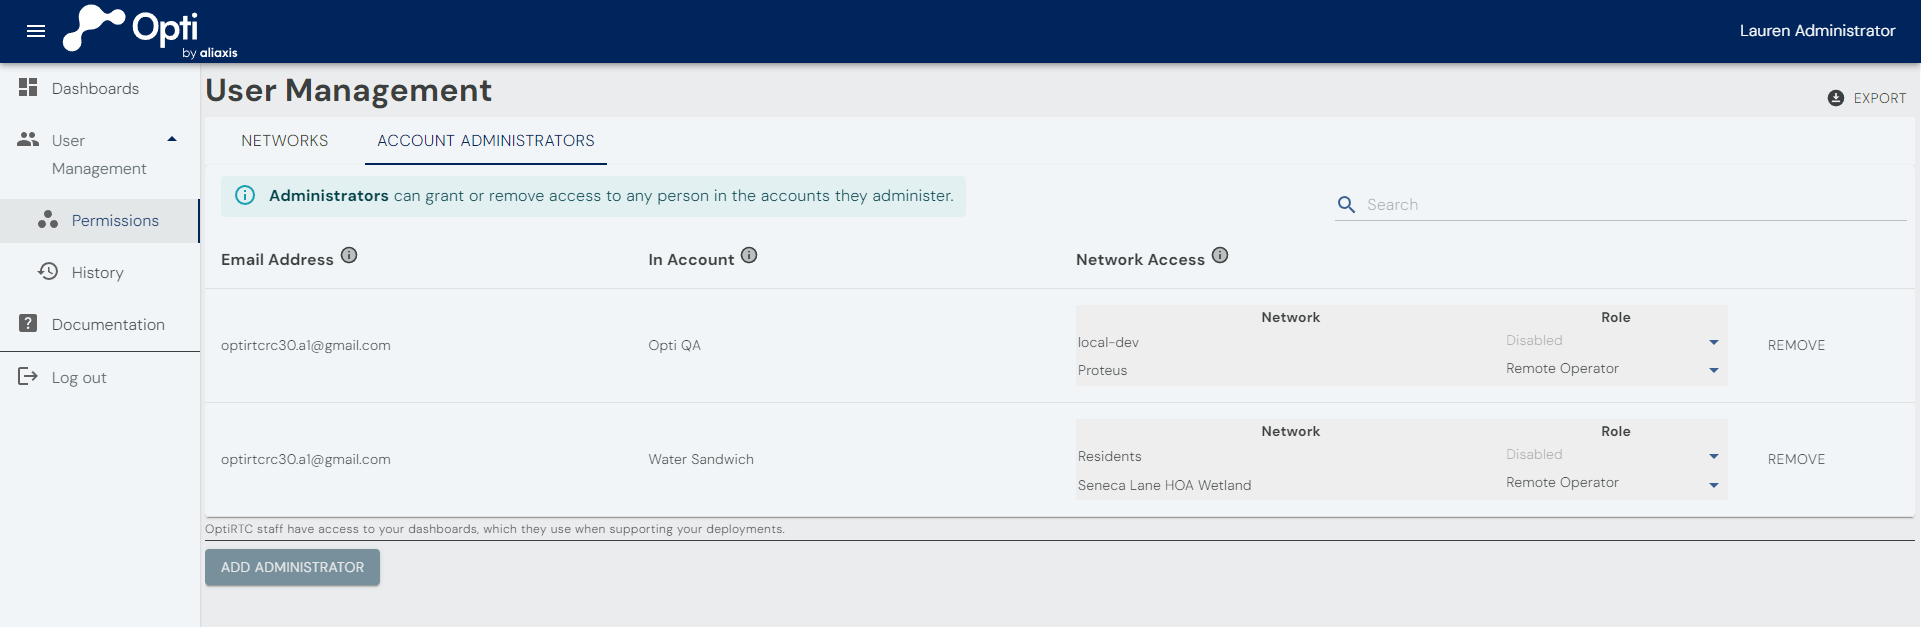
Manage Account Administrators
The Account Administrators tab allows Account Administrators to manage administrator access for their organization. From this page, you can:
- Add or remove Account Administrators.
- Assign Network access and roles.
- Search or export administrator permissions.
Add an Account Administrator
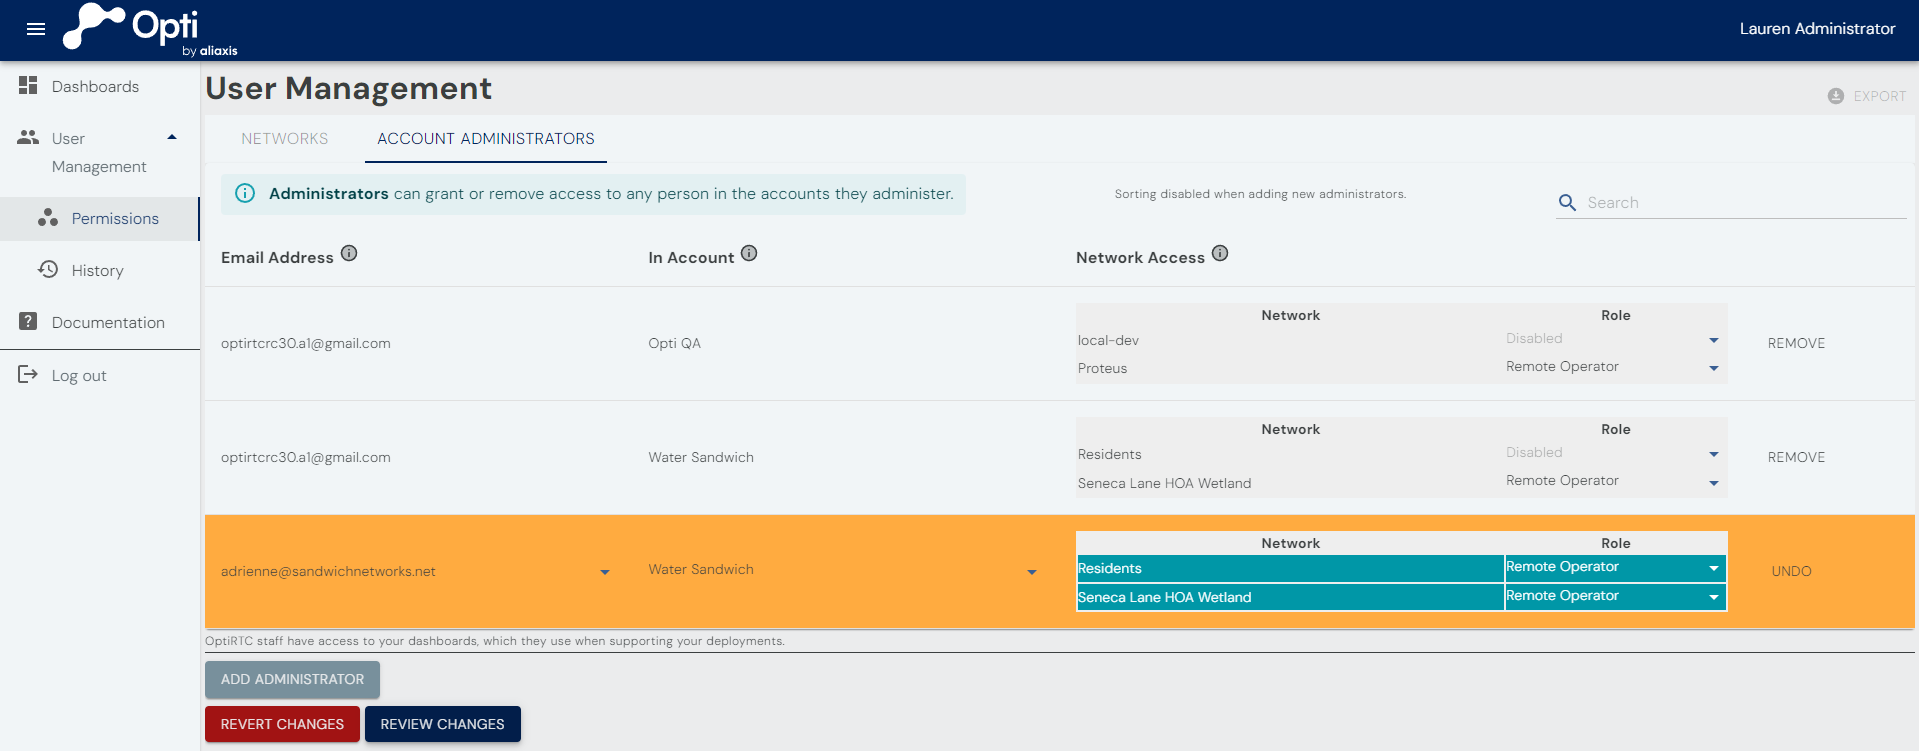
- Select the Account Administrators tab.
- Click Add Administrator.
- Enter the user's email address.
- Select the Account.
- (Optional) Assign Network roles.
- Click Review Changes, enter a note, and select Save.
If the user has not previously signed in, they will receive an invitation email.
Note
Network access can be assigned during setup or later from the Networks tab.
Update an Administrator's Network Access
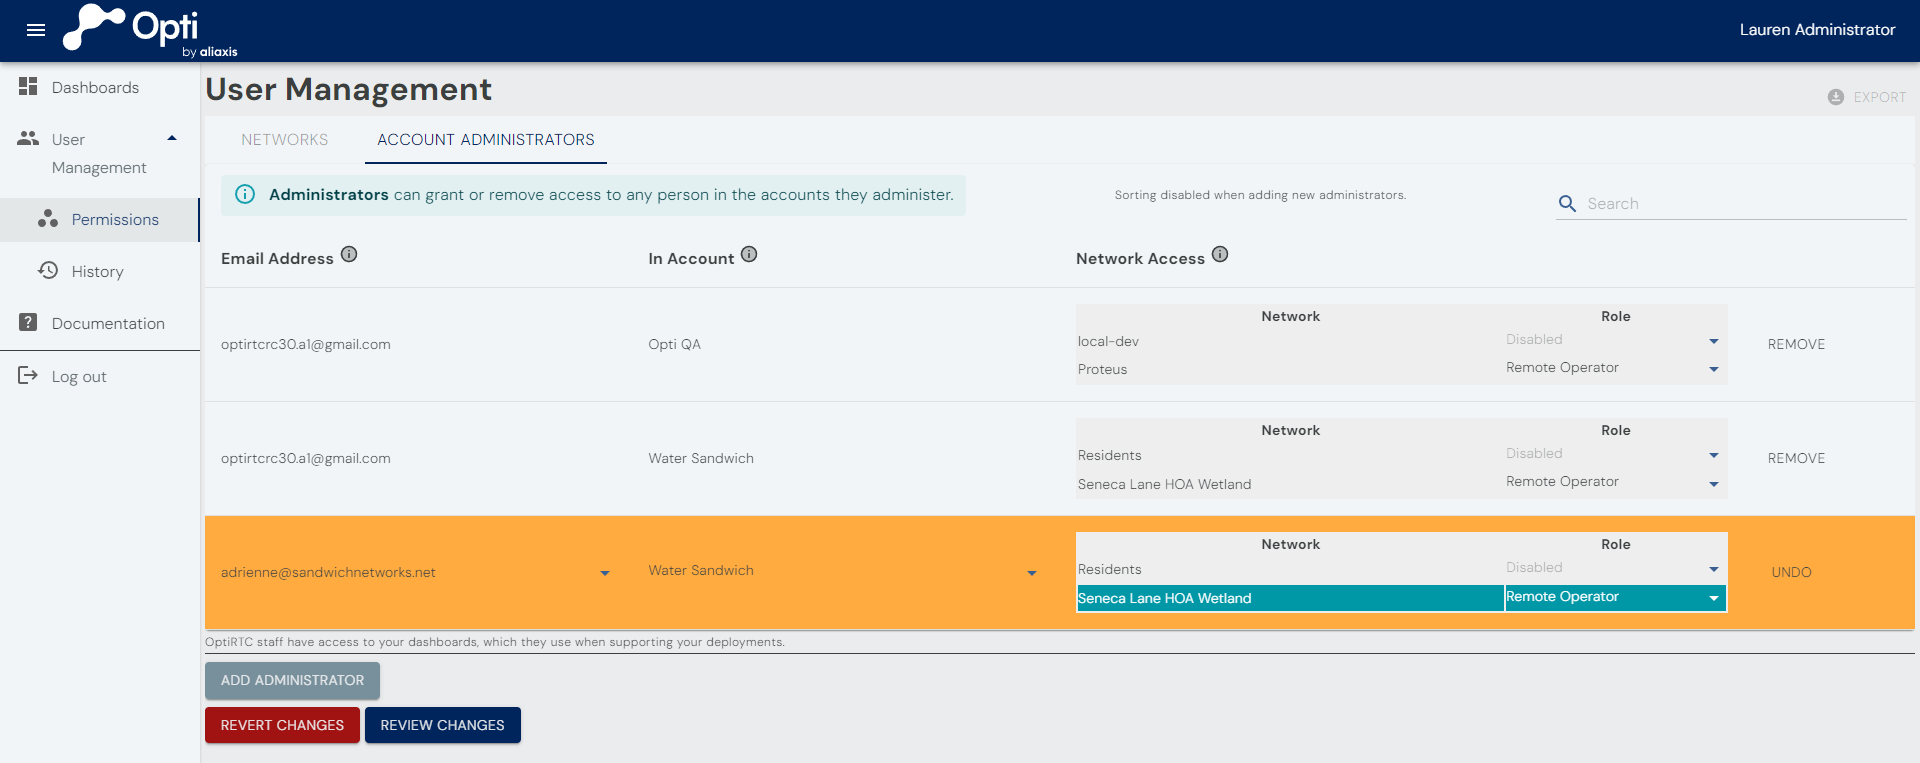
Administrators can be assigned one of the following roles for each Network:
- Remote Operator
- View Only
- Disabled (no Network access)
Select a new role from the Network Access column, then click Review Changes, add a note, and select Save.
Remove an Administrator
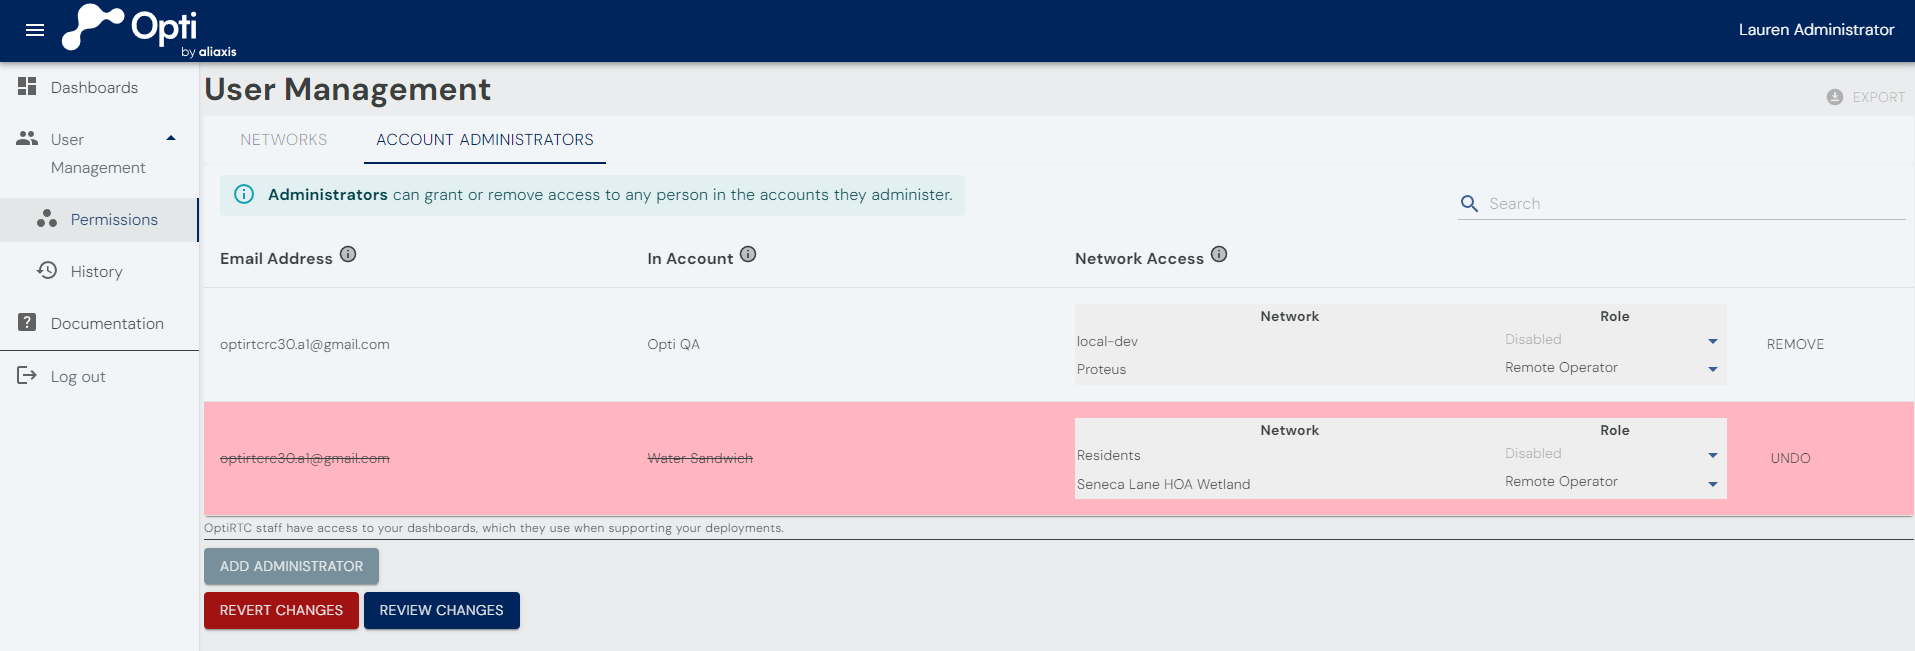
Click Remove beside the administrator, then select Review Changes, enter a note, and click Save.
Note
Administrators are not allowed to remove themselves from the Account, which ensures at least one Administrator exists for every Account. Administrators must have at least one Network role other than Disabled or they will encounter a permissions error when accessing dashboards.
History
The History page records all user management changes for the Accounts you administer, including user invitations, role changes, and administrator updates, enabling Administrators to audit access to their systems.
From this page, you can:
- Search the history log.
- View change details and notes.
- Export the full history as a CSV file.

Search History
Use the Search box  to quickly find users, Accounts, Networks, roles, or notes.
Export History
Click Export to download a CSV of all history records available to your account. The CSV file can be opened by Excel and other common CSV tools.
Note
Export always includes the complete history, regardless of any filters applied.
Platform Limits
- Up to 10 Account Administrators per Account.
- Up to 30 users with any role per Account and all of its Networks by default. Contact support@optirtc.com to request a higher limit.
- The Opti Management Portal is supported on mobile browsers but is optimized for desktop use.
User Management Included In Your Existing Subscription
There are no additional charges associated with the use of User Management features. All Accounts have always been able to provide access to users as either View Only or Remote Operator. The user management features available at https://manage.onopti.com make the ability to change or audit who has access to your systems available to Account Administrators.
Support and Feedback
Product Documentation
Open the Navigation Menu by clicking the three-line menu icon in the top left corner. Then scroll to the bottom and click the Documentation menu item to open the product documentation site in another tab. The user guide for the Legacy Opti Portal is also available there.
Requesting Support and Providing Feedback
The Support and Feedback menu has forms for contacting customer support and providing product feedback. You can also send an email to support@optirtc.com or call 1-844-678-4782 extension 2. Opti Customer Support is available Monday through Friday, 9:00 AM to 5:00 PM Eastern Time (ET), excluding U.S. federal and Opti-observed holidays, and will respond to inquiries from authorized users within one business day.
See the Software License and Services Agreement for more information about support response.