Opti Platform Integrations
Overview
The Opti Platform consists of several applications working together:
- The Opti Cloud provides service-assisted communications with Opti Panels, device management, watershed analytics and operations, notifications, APIs integrating with customer telemetry and applications, and integrations with 3rd party sources of data.
- Each Opti Panel runs Opti Thunder, a firmware application that enables smart stormwater facility management via configuration.
- The Opti Portal and Opti Management Portal provide web-based access to stormwater facilities managed by the Opti Platform.
This document describes each of the 3rd party sources of data that are available as optional integrations with every Opti Account. It is intended to help engineers, designers, IT professionals, and program managers identify built-in options that empower them to create the right combination of technology and services for the stormwater management challenges their communities face.
Observed vs. Forecast Data
The Opti Platform distinguishes between observed and forecasted data. Observed data is collected from sensors in the field, while forecasted data is derived from models that predict future conditions based on past observations. Different data sources provide one or both types of data, which can be used in different ways on the Opti Platform. In addition to observed data from sensors connected to the Opti Panel, all Opti CMAC facilities require at least one source of rainfall forecast data to operate.
Data sources that provide observed data are marked with a Observed label, while those that provide forecast data are marked with a Forecast label. Some data sources provide both observed and forecast data, in which case both labels appear.
NOAA National Weather Service
Forecast
The default option used for predictive control of stormwater facilities on the Opti Platform is the NOAA National Weather Service. National Weather Service forecasts are available on a 2.5 km x 2.5 km grid. The following parameters are available for use as forecast inputs to CMAC facilities, and/or in visualizations on Opti Portal Dashboards:
| Parameter | Units | Temporal Resolution |
|---|---|---|
| Probability of Precipitation (POP) | % (0-100) | 12 hours |
| Quantitative Precipitation Forecast (QPF) | inches | 6 hours |
The Opti Platform collects forecasts for at least the next 48 hours from the time of each request and requests new information from the National Weather Service every 30 minutes. The Opti Platform uses the most recent forecast data available from the National Weather Service for each facility and automatically updates the forecast inputs to CMAC facilities as new data is collected.
Tomorrow.io
Forecast
Tomorrow.io provides rainfall forecasts with greater spatial and temporal resolution and a longer future horizon than NOAA's National Weather Service. Specifically, Tomorrow.io forecasts are available on a 0.5 x 0.5 km grid, with 1-hour temporal resolution. This is achieved by fusing proprietary datasets and prediction modeling with public weather prediction models, including those from NOAA and ECMWF. The Opti Platform integrates with Tomorrow.io's enhanced rainfall forecasts to support CMAC on facilities that require more than 48 hours to fully draw down, in places not served by the National Weather Service forecasts, and in areas where mountains, coasts, and other conditions make NOAA's rainfall forecasts less accurate.
The following parameters are available for use as forecast inputs to CMAC facilities and/or in visualizations on Opti Portal Dashboards. Note that Precipitation Intensity refers to an aggregate of all forms of precipitation, including rain, snow, sleet, and freezing rain.
| Parameter | Units | Temporal Resolution | CMAC Forecast Option | Visible On Opti Portal |
|---|---|---|---|---|
| Precipitation Intensity | in/hr | Hourly | Yes | Yes |
| Precipitation Intensity | in/hr | Minutely | No | Yes |
| Precipitation Probability | % | Hourly | Yes | Yes |
| Precipitation Probability | % | Minutely | No | Yes |
| Rainfall Intensity | in/hr | Hourly | Yes | Yes |
| Rainfall Intensity | in/hr | Minutely | No | Yes |
| Freezing Rain Intensity | in/hr | Hourly | Yes | Yes |
| Freezing Rain Intensity | in/hr | Minutely | No | Yes |
| Sleet Intensity | in/hr | Hourly | Yes | Yes |
| Sleet Intensity | in/hr | Minutely | No | Yes |
| Snow Intensity | in/hr | Hourly | Yes | Yes |
| Snow Intensity | in/hr | Minutely | No | Yes |
Online Status
The Opti Platform collects a new view of the Tomorrow.io forecast every 5 minutes. In addition to the forecast metrics collected from Tomorrow.io, an Online Status metric tracks whether new data was collected from the Tomorrow.io services each time the Opti Platform collects a new view of the forecast. If there is an issue collecting the new view of the forecast, the Online Status will be set to "OFFLINE." Otherwise, it will be set to "ONLINE."
NOAA Tides and Currents
Observed Forecast
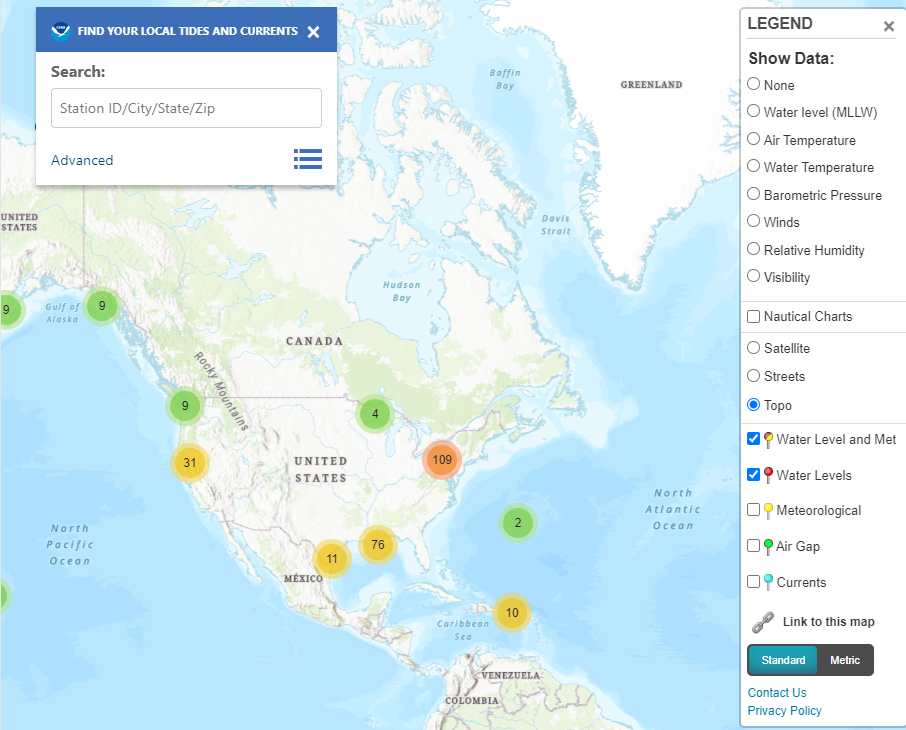
Tidally influenced water bodies can create or exacerbate backwater conditions in collection systems, preventing water from draining as fast as it typically would. In Combined Sewer (CSO) communities, releasing stormwater at the wrong time can contribute to consent decree violations. The National Oceanic and Atmospheric Administration (NOAA) operates the Tides & Currents service, which provides the public access to real-time observations and predictions of water levels in coastal areas. The Opti Platform can integrate with observed and forecasted water levels from Tides and Currents Stations for use as inputs to control facilities' Coordinated Release logic, enabling upstream assets to take account of downstream tidal conditions in their decision-making logic. Specifically, for a given tidal station, Opti will collect the following information resources.
Info
All water level parameters are available in one or more of the following datums, depending on how the specific station publishes data. Your Opti Account manager will work with you to make sure data is available in a datum compatible with your other Opti deployments. Supported datums include:
- Mean Sea Level (MSL)
- National Geodetic Vertical Datum (NGVD29)
- North American Vertical Datum 88 (NAVD88)
Observed Data
The following observed parameters are available from the NOAA Tides and Currents service for use as inputs to CMAC facilities and/or in visualizations on Opti Portal Dashboards.
| Parameter | Units | Observation Period | Reporting Period | Opti Refresh Period |
|---|---|---|---|---|
| Observed Water Level | ft | 1 minute | 6 minutes | 15 minutes |
Info
It takes ~2-4 minutes for data observations in the field to be published to NOAA's web services, where the Opti Platform can collect them. Given that tide observations typically update every 6 minutes, it is very common for "the most recent available data" to be 8-10 minutes behind "now." Opti Customer Success can make recommendations to adjust Control Deployment configurations to account for this end-to-end latency based on the objectives of each facility.
Forecast Metrics
Forecast metrics from NOAA Tides and Currents are derived from astronomical tide tables and are only periodically integrated with observed status. Unlike rainfall forecasts, NOAA Tides and Currents forecast metrics are only available for input to Opti Coordinated Release and visualization on Opti Portal Dashboards.
| Parameter | Units | In the Next X Hours |
|---|---|---|
| Highest astronomical tide | ft | 1 |
| Highest astronomical tide | ft | 2 |
| Highest astronomical tide | ft | 3 |
| Highest astronomical tide | ft | 13 |
| Highest astronomical tide | ft | 26 |
| Lowest astronomical tide | ft | 1 |
| Lowest astronomical tide | ft | 2 |
| Lowest astronomical tide | ft | 3 |
| Lowest astronomical tide | ft | 13 |
| Lowest astronomical tide | ft | 26 |
| Time until highest astronomical tide | hours | 1 |
| Time until highest astronomical tide | hours | 2 |
| Time until highest astronomical tide | hours | 3 |
| Time until highest astronomical tide | hours | 13 |
| Time until highest astronomical tide | hours | 26 |
| Time until lowest astronomical tide | hours | 1 |
| Time until lowest astronomical tide | hours | 2 |
| Time until lowest astronomical tide | hours | 3 |
| Time until lowest astronomical tide | hours | 13 |
| Time until lowest astronomical tide | hours | 26 |
Tip
To capture the highest and lowest tides in the next tidal cycle, select the 13-hour option for semi-diurnal and mixed semi-diurnal tidal cycles and the 26-hour option for diurnal cycles. Information about the distribution of tidal cycles can be found here.
Online Status
In addition to the Observed and Forecast metrics collected from each station, Opti provides an Online Status metric that tracks whether data points from the NOAA service were collected within 1.35 times the Reporting Period, plus 10 minutes. If no data points are collected within this time, the Online Status will be set to "OFFLINE." If values are later collected within that past window, the Online Status will be marked as "DELAYED." If only some of the values are collected within the expected window of time after they were reported by NOAA, the Online Status will be marked as "PARTIAL."
ADS Prism
Observed
ADS Prism provides cloud-based access to data from ADS Environmental Services environmental monitoring devices. The Opti Platform integrates with ADS Prism Locations from an ADS Account. Opti Support or your Opti Account Manager can show you how to use your ADS Prism API key with the ADS Developer Portal to get started.
Locations on ADS Prism represent a single monitoring point. The parameters included depend on the type of ADS device installed. The Opti Platform supports integrations with the following ADS devices and parameters, both for visualization on the Opti Portal and as inputs to Opti CMAC Coordinated Release:
| ADS Device | ADS Entity ID | ADS Entity |
|---|---|---|
| All | 4801 | Battery Voltage |
| All | 4404 | Temperature |
| Echo Level Monitor | 6650 | Elevation |
| Echo Level Monitor | 4122 | Depth |
| Echo Level Monitor | 2143 | Level |
| Triton Flow Meter | 3337 | Volumetric Flow |
| Triton Flow Meter | 4202 | Linear Flow |
| Triton Flow Meter | 3338 | Total Flow |
| Rain Alert | 2123 | Rain |
Increase Reporting Frequency for CMAC Inputs
When using monitoring devices as an input to Continuous Monitoring and Adaptive Control (CMAC), minimizing the time it takes for sensor readings to be available for decision-making is critical to achieving the best results. This presents a tradeoff: systems that are solar or battery-powered may require bigger solar panels or more regular battery replacements if they transmit data to the cloud more than a few times per day. Opti recommends 5-minute reporting intervals for most applications. In general, system responsiveness should not be assumed to be less than twice the slowest reporting interval it depends on.
Online Status
In addition to the metrics collected from each ADS Prism Location, Opti provides an Online Status metric that tracks whether data points from each ADS Location were collected within 1.35 times the expected Reporting Period of that device. If no data points are collected within this time, the Online Status will be set to "OFFLINE." If values are later collected within that past window, the Online Status will be retroactively marked as "DELAYED." If only some of the values from a Location are collected within the expected window of time after they were reported by ADS, the Online Status will be marked as "PARTIAL."
SmartCover Systems
Observed
SmartCover Systems provides sewer and surface water monitoring devices with form factors that uniquely fit into the collection system. Their product catalog offers a way of monitoring almost any downstream condition that might influence upstream operations and provides many solutions that do not require confined space entry. To integrate data from your SmartCover deployments with your Opti Account, you will require an API key for your SmartCover Account.
The Opti Platform integrates with SmartCover Locations, which correspond to individual SmartFloe, SmartCSO, SmartLevel, or SmartRain devices. Each of the SmartCover products provides the following parameters that can be added to Opti Dashboards or used as inputs to Opti CMAC Coordinated Release.
SmartFLOE
By applying Manning's equation to water level, SmartFloe is a cost effective means to estimate flow rates in open channels.
| Parameter | Unit of Measure |
|---|---|
| PowerPack Voltage | V |
| Water Level above Bottom | in |
| Temperature | F |
| Signal Strength | B |
| Signal Quality | |
| SmartFLOE | MGD |
SmartLevel
SmartLevel enables monitoring water levels inside of sewers with a combination of ultrasonic and pressure sensors.
| Parameter | Unit of Measure |
|---|---|
| PowerPack Voltage | V |
| Water Level above Bottom | in |
| Signal Strength | B |
| Signal Quality | |
| Temperature | F |
SmartCSO
SmartCSO deployments provide water level monitoring at CSO outfalls, enabling upstream Opti facilities to proactively manage stormwater releases to avoid consent decree violations.
| Parameter | Unit of Measure |
|---|---|
| PowerPack Voltage | V |
| Water Level above Bottom | in |
| Temperature | F |
| Signal Strength | B |
| Signal Quality |
SmartRain
SmartRain integrates SmartCover level and flow data with Doppler radar and local rain gauge data to estimate rainfall at any location in a community.
| Parameter | Unit of Measure |
|---|---|
| Temperature | F |
| Rain | in/hr |
| Atmospheric Pressure | inHg |
Online Status
In addition to the metrics collected from each SmartCover device, Opti provides an Online Status metric that tracks whether data points from each SmartCover Location were collected within 1.1 times the expected reporting period of that device. If all data points are collected within that window, the Online Status will be set to "ONLINE." If no data points are collected within this time, the Online Status will be set to "OFFLINE." If values are later collected within that past window, the Online Status will be marked as "DELAYED." If only some of the values from a Location are collected within the expected window of time after they were reported by SmartCover, the Online Status will be marked as "PARTIAL."
Barn Owl Cameras
Observed
Barn Owl provides fully off-grid remote monitoring cameras that can be used to monitor stormwater facilities. The Opti Platform integrates with Barn Owl cameras to provide a time-lapse feed of stormwater facilities, which can be used to monitor conditions in real time and support operations and maintenance (O&M) goals. When integrated with the Opti Platform, a time-lapse feed of the images from your camera will be added to the Opti Portal dashboard for the facility where the camera is installed. This integration is fully compatible with Event Explorer and allows you to browse your camera's image history like any other sensor connected to the Opti Platform, giving you a visual record of site conditions during each rainfall event.
To connect a Barn Owl camera to your Opti Account, you will first need to create a Barn Owl Account, purchase, and install the camera at your facility. To configure the camera to send images to the Opti Platform:
- Open the Settings menu on the Barn Owl camera.
- The Opti Platform supports images up to 750kb in size. Depending on when you purchased your camera, this means choosing "SD Photos" or specifying a Pic Size of less than "Full" ("Large" images work well).
- Set the Time Lapse feature to On, and specify an interval no shorter than one image every 5 minutes.
- Open the Alerts menu on the Barn Owl camera.
- Turn on Email Alerts if it is not already enabled.
- Use the camera-serial-number@cameras-v2.optirtc.com (where camera-serial-number is the serial number of your Barn Owl camera) as the email address to send images to.
- Retrieve the camera's IMEI Number from the Barn Owl Camera Profile.
- Send your camera's serial number, IMEI number, the Time Lapse interval you configured, the Latitude and Longitude coordinates of the camera's location, and the name of the CMAC facility you would like the camera associated with to your Opti Account Manager or Opti Support to complete the integration.
Info
Depending on the size of the images you send and how often you send them, you may need to choose a different Barn Owl data plan.
Online Status
The Opti Platform assumes your Barn Owl camera will send an image every Time Lapse interval you configured. If the camera does not send an image within 1.35 times the Time Lapse interval since the last collected image, the Online Status will be set to "OFFLINE." Otherwise, the Online Status metric will be set to "ONLINE."
SCADA Systems and Other Data Sources
Observed
The Opti Platform provides multiple paths for integrating data from SCADA systems and other data sources that support Modbus RTU, or can make HTTPS POST requests over the public internet. These options are intended for use by Opti Partners and customers with the technical expertise to configure their systems to send data to the Opti Platform. For further details on how to send data to the Opti Platform via HTTPS POST requests, see the Device Telemetry API documentation. To integrate data sources with the Opti Platform via Modbus RTU, please contact your Opti Account Manager or Opti Support to discuss options.